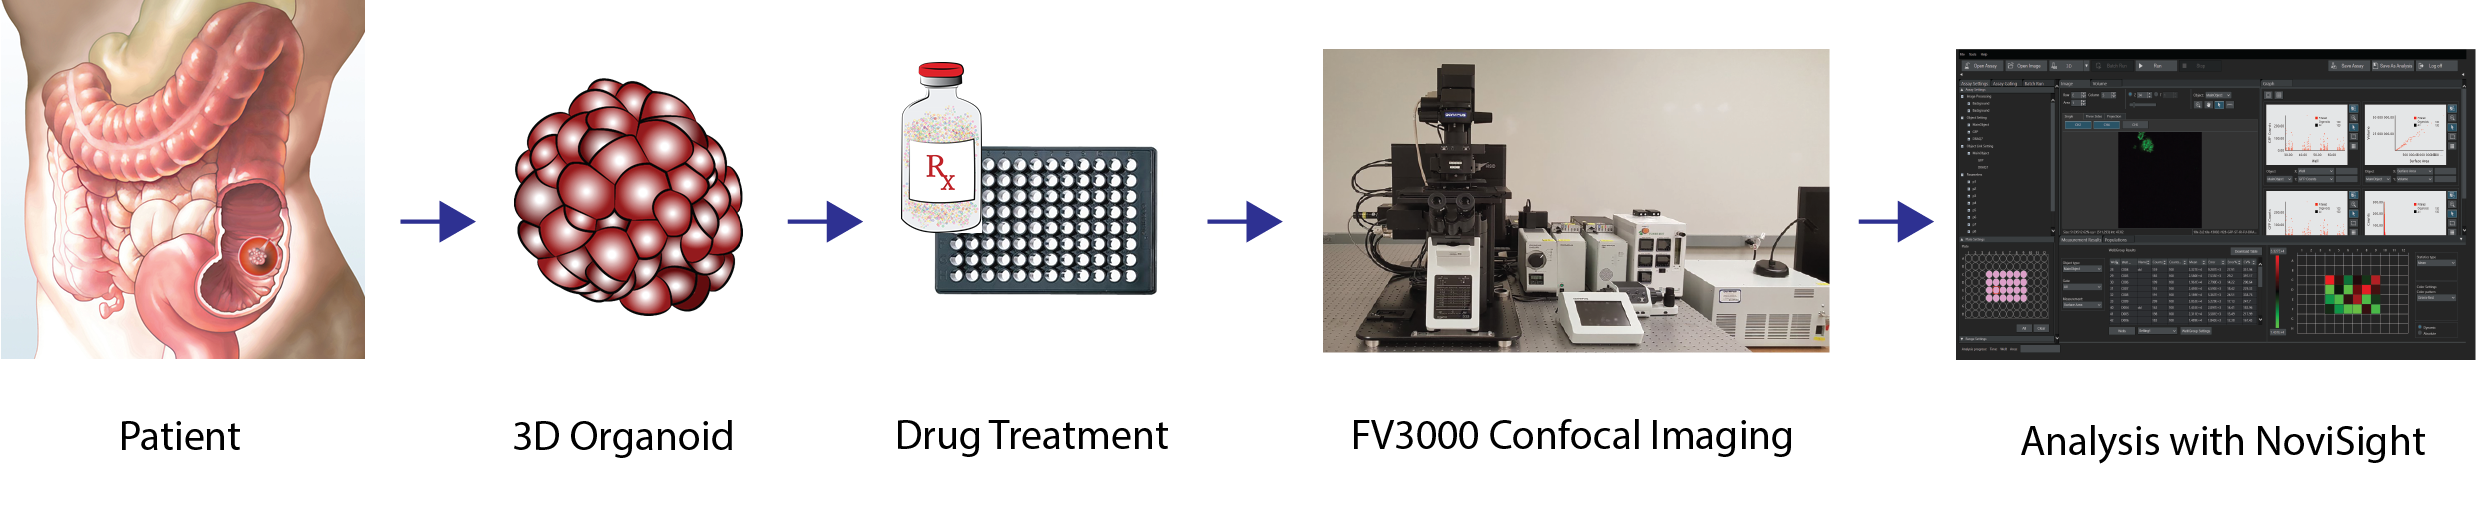
High-Throughput 3D Organoid Imaging Data Analysis Workflow Using Cell Analysis Software with True 3D Technology
Introduction
3D organoids have been used to mimic physiological microenvironments and gather more detailed insights into drug responses. Multidimensional imaging of organoids can generate information-rich data, capturing multiple parameters over several time points. However, traditional image analysis software are oftentimes not optimized for establishing batch analysis pipelines to collect large-scale imaging data. Counterintuitive user interfaces as well as complex data processing steps make high-throughput image analysis difficult. In this study, we used Olympus’ NoviSight™ software to compose a more efficient 3D organoid image analysis workflow.
Appliction Workflow
Benefits
- Quick and efficient analyses of multi-well 3D imaging data
- High consistency achieved with batch analysis
- Interactive data presentations (thumbnail image gallery, heatmap, measurement tables, correlation graphs, and gate settings)
Experiment: Growth-Suppression Efficacy of Drug Therapies on Colon Cancer Patient-Derived Tumor Organoids
Methods
Organoid Culture
Colon cancer patient-derived tumor organoids were grown in Costar® 96-well plates (Corning) and treated with serial dilutions of Irinotecan (IR) and 5-Fluorouracil (5-FU), which are clinically used therapies, as well as Staurosporine (ST), a positive control.
Confocal Imaging with the FV3000 Laser Scanning Confocal Microscope
Organoid imaging was performed with the FLUOVIEW™ FV3000 laser scanning confocal microscope. H2B-GFP-labeled organoid images were gathered with a 10X objective. Z-stack images were acquired with a 5 μm step size.
Image Analysis Using NoviSight 3D Cell Analysis Software
- Image File Loading
Load the entire plate’s image data to analyze multiple images simultaneously. - Establishing Analysis
In “Object Settings,” fine-tune the segmentation of objects within each channel. - Running Analyses
Upon establishing the analysis settings, run the analysis for the entire plate. Analysis can also be run as a “Batch Analysis” to apply the same analysis workflows to multiple data sets concurrently.
NoviSight Software Features That Facilitated 3D Organoid Imaging Analysis
Segmentation Preview
Adjustments to analysis settings such as detection thresholds, adaptive intensities, and filtering can be visualized in the preview window to verify that the desired signals are being detected correctly. This preview window can be switched to any well and z-stack without readjusting settings, enabling the user to quickly and comprehensively fine-tune each parameter before analyzing the entire data set.
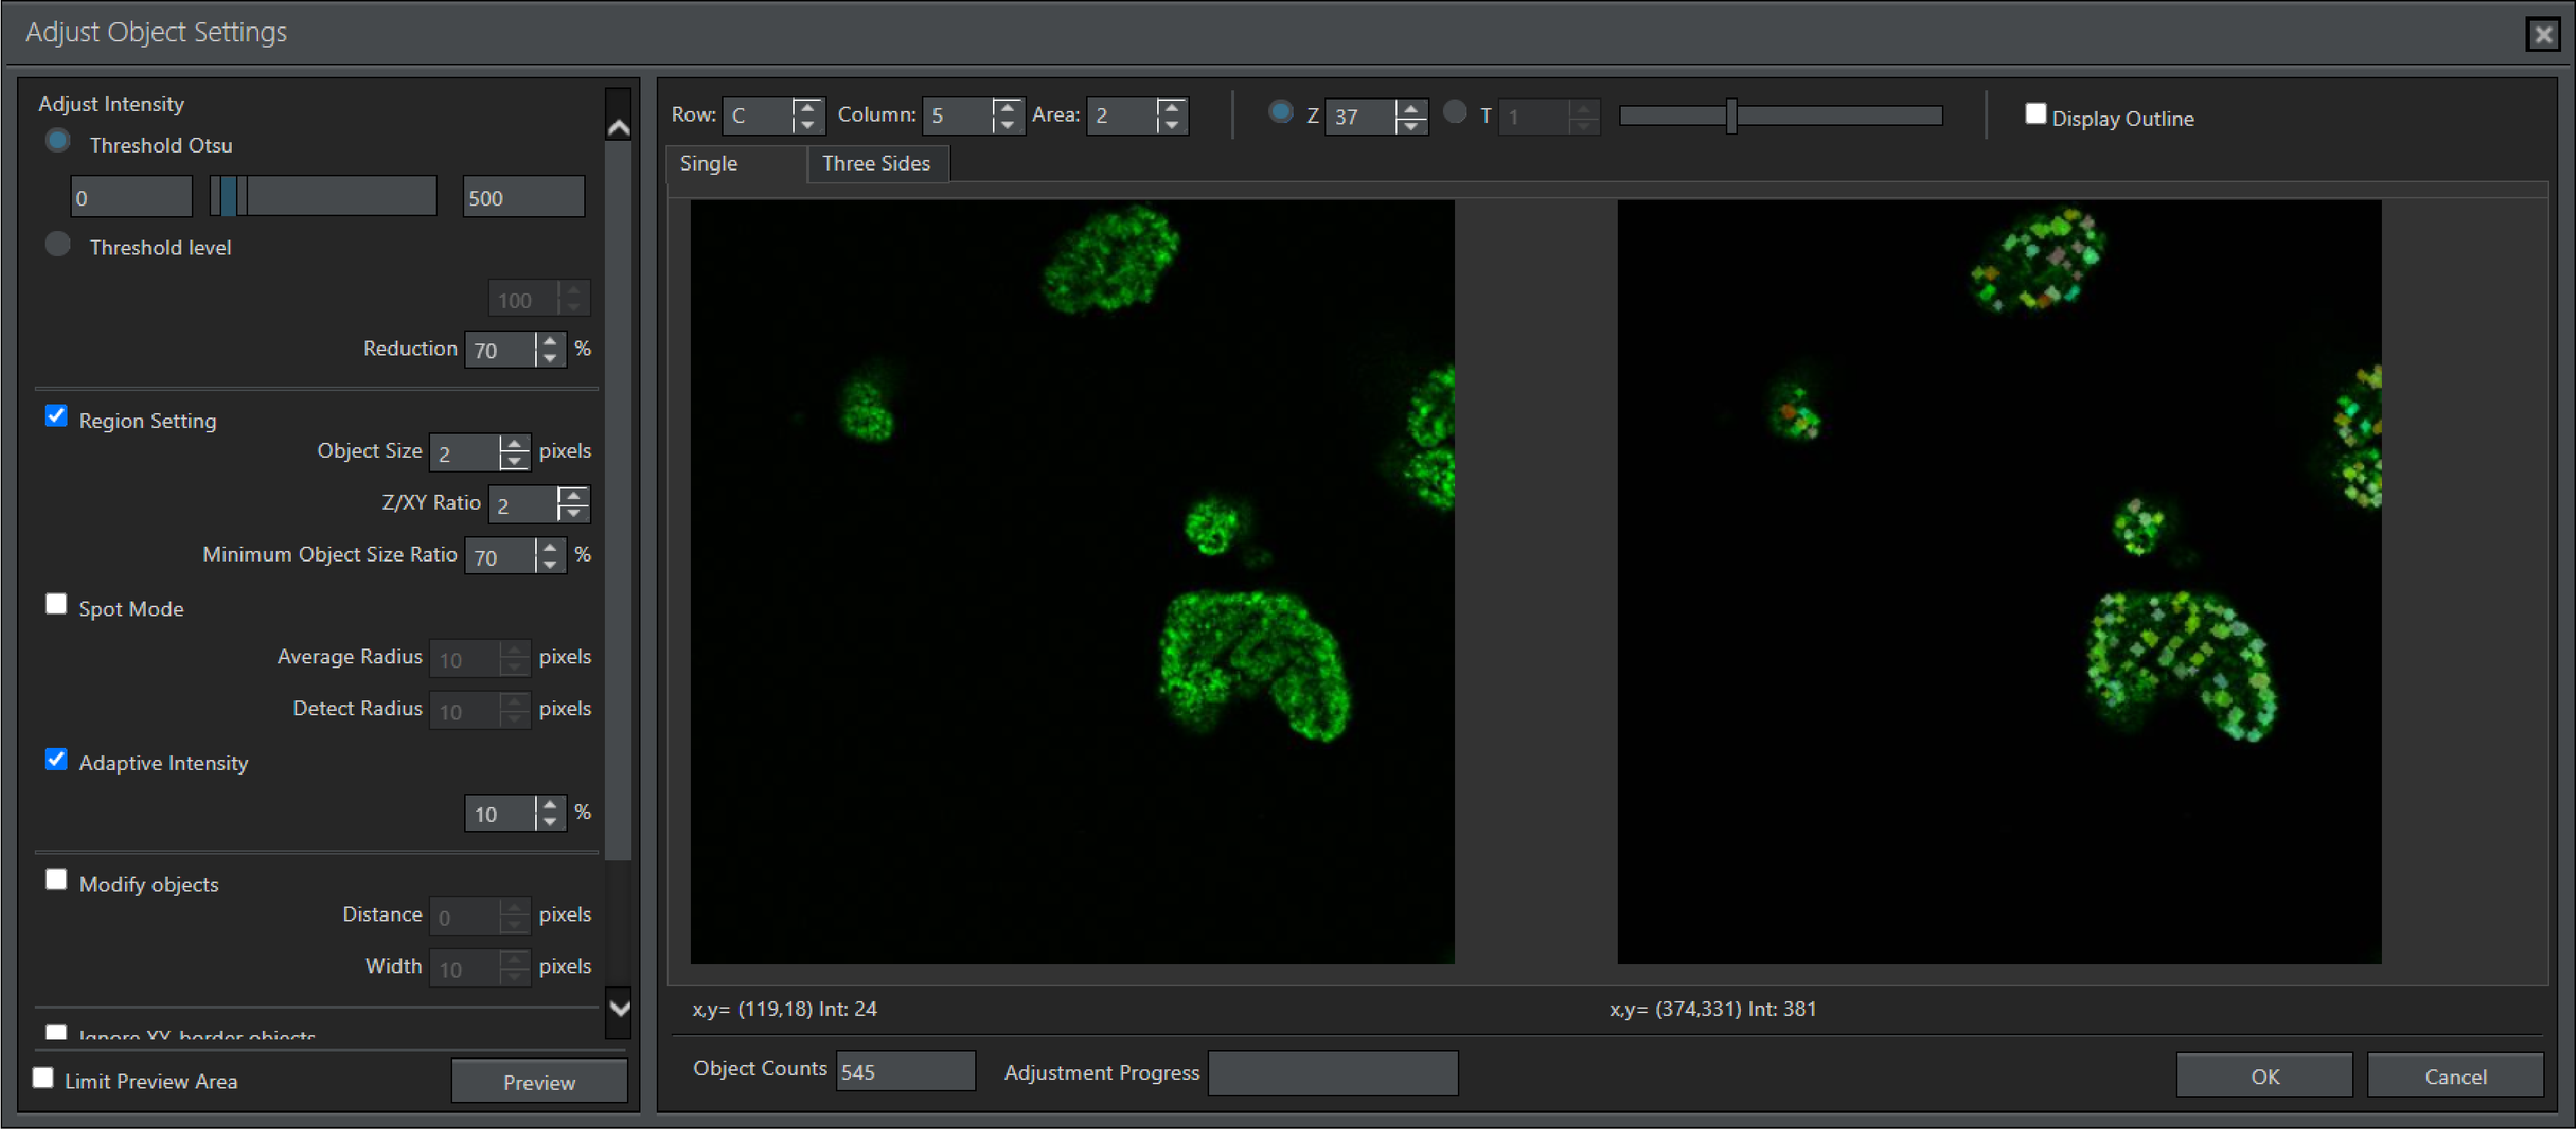
Segmentation preview in NoviSight software: original image without any adjustments (left) and the preview image showing the detected GFP signals after the Adjust Object Settings are applied (right).
Graphs—Gating
Upon running the analysis, NoviSight software auto-generates several figures, including various customizable graphs. These figures enable the user to select the objects and gate the organoids by specific parameters. Clicking any datapoint will highlight the corresponding object in the original image, which is useful when setting gate thresholds. Gated objects can then be collectively displayed with the Gallery view, enabling the user to quickly assess the accuracy of object classification from large data sets.
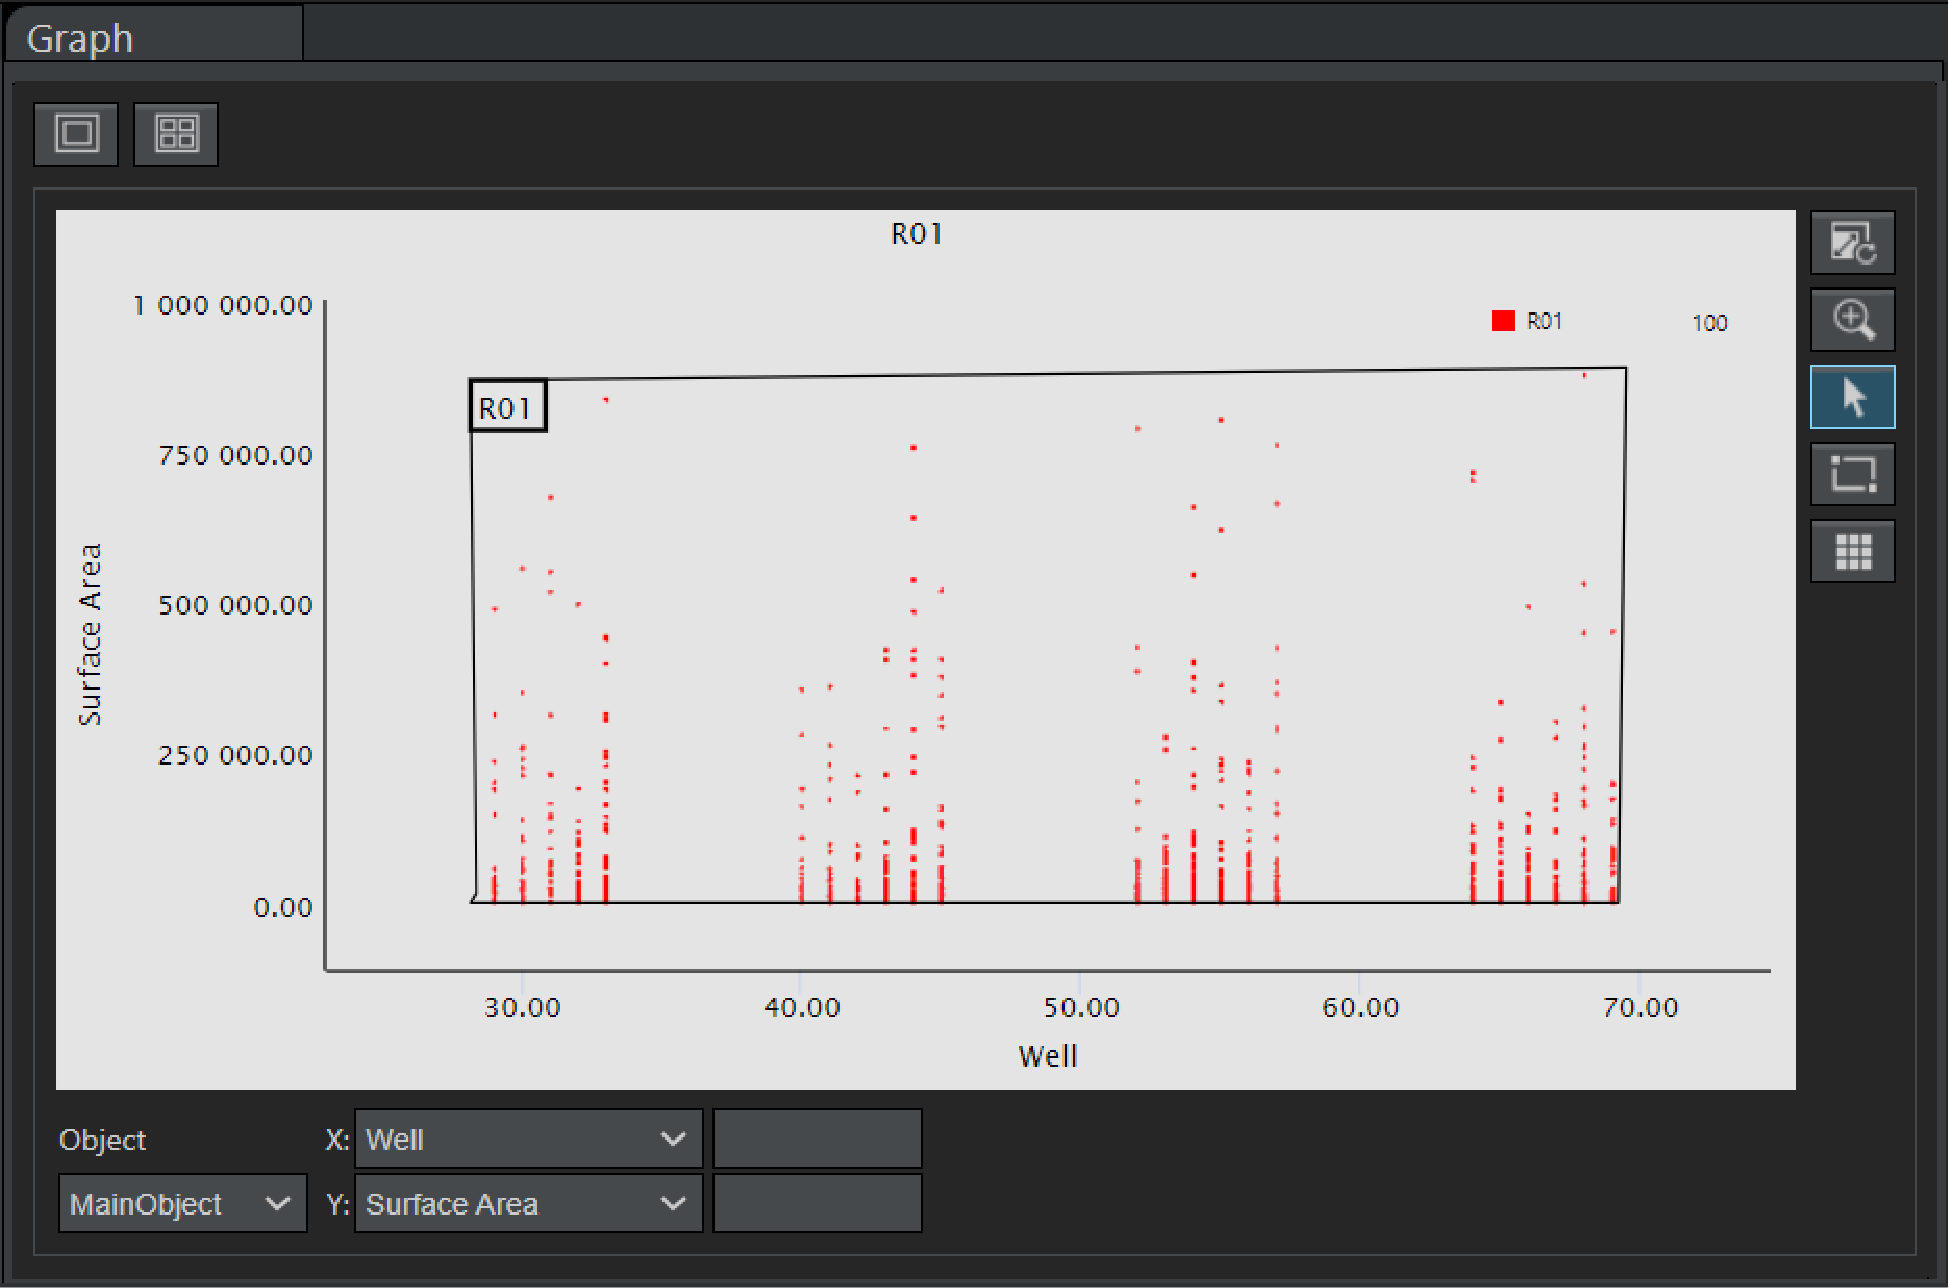 | 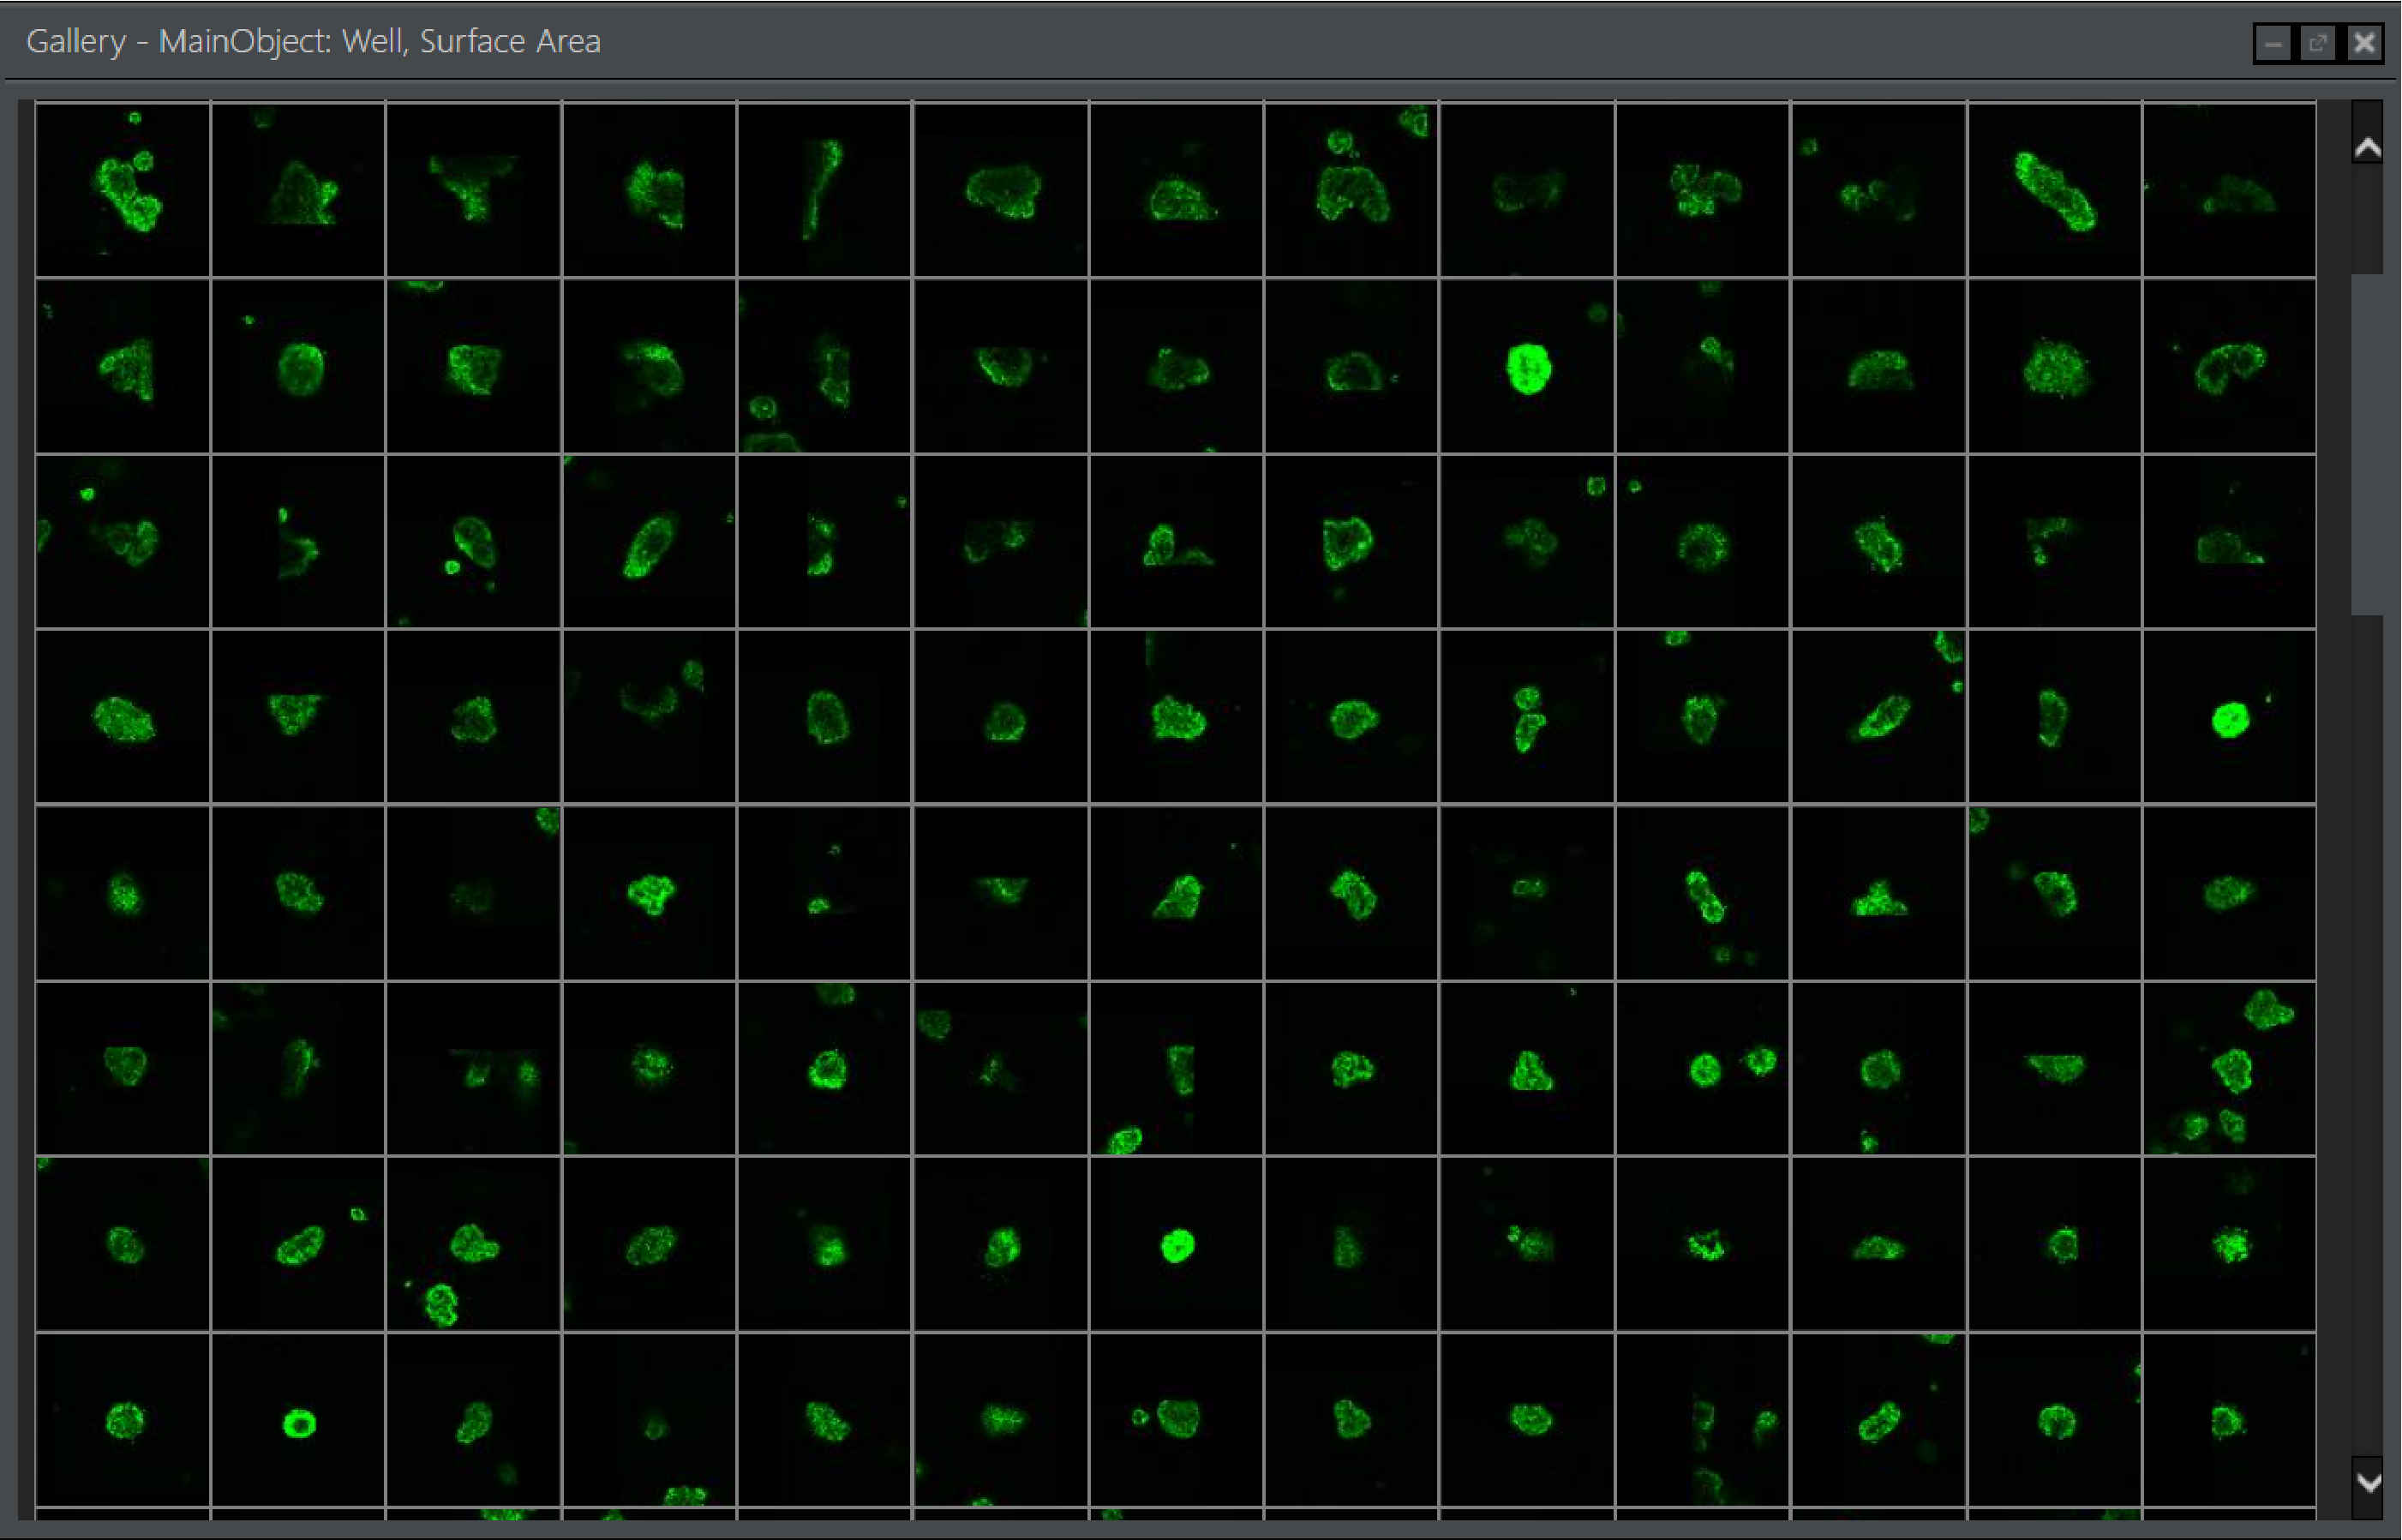 |
Scatterplot showing gated individual organoid surface areas from each well (left), and the Gallery view showing the gated organoids from the entire plate with GFP (right). |
Heat Map
NoviSight software automatically generates a heat map that enables the user to quickly examine the entire plate’s data. The heat map’s color coding helps streamline the data analysis by highlighting trends and monitoring discrepancies. Furthermore, selecting a well highlights the corresponding original image. This interactive feature maximizes the efficiency of imaging-based analysis as the user can conveniently check the measurements or signal distributions throughout an entire plate.
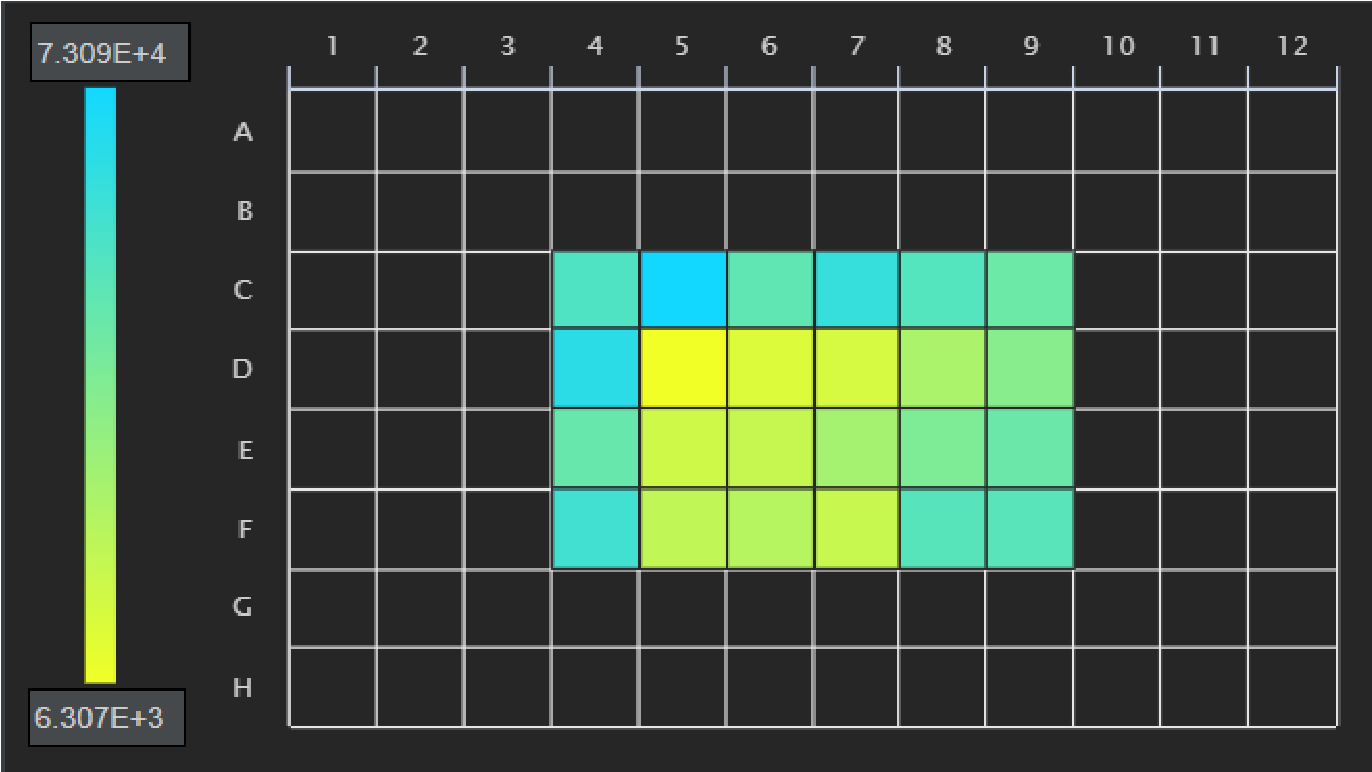
Heat map of surface area values at Day 6 after drug treatments. Row C and column 4 are untreated controls. Wells D5 to D9 were treated with 1, 0.1, 0.001, 0.0001 μM ST respectively, wells E5 to E9 were treated with 50, 10, 1, 0.1, 0.01 μM IR respectively, and wells F5 to F9 were treated with 100, 50, 10, 1, 0.1 μM 5-FU respectively. Blue: larger surface area. Yellow: smaller surface area.
Data Table
Data produced by the analysis is consolidated into a table that averages the values for each measurement by well. The program also provides the error associated with each mean and can be easily exported as a .csv file with the “Download Table” function. These features expedite post-analysis processing and limit user-induced variabilities by removing the need to manually manipulate datapoints and calculate values. Like the scatterplots and heat map, selecting a value on the data table enables the user to check the corresponding image in the viewing window, supporting the data validation process.
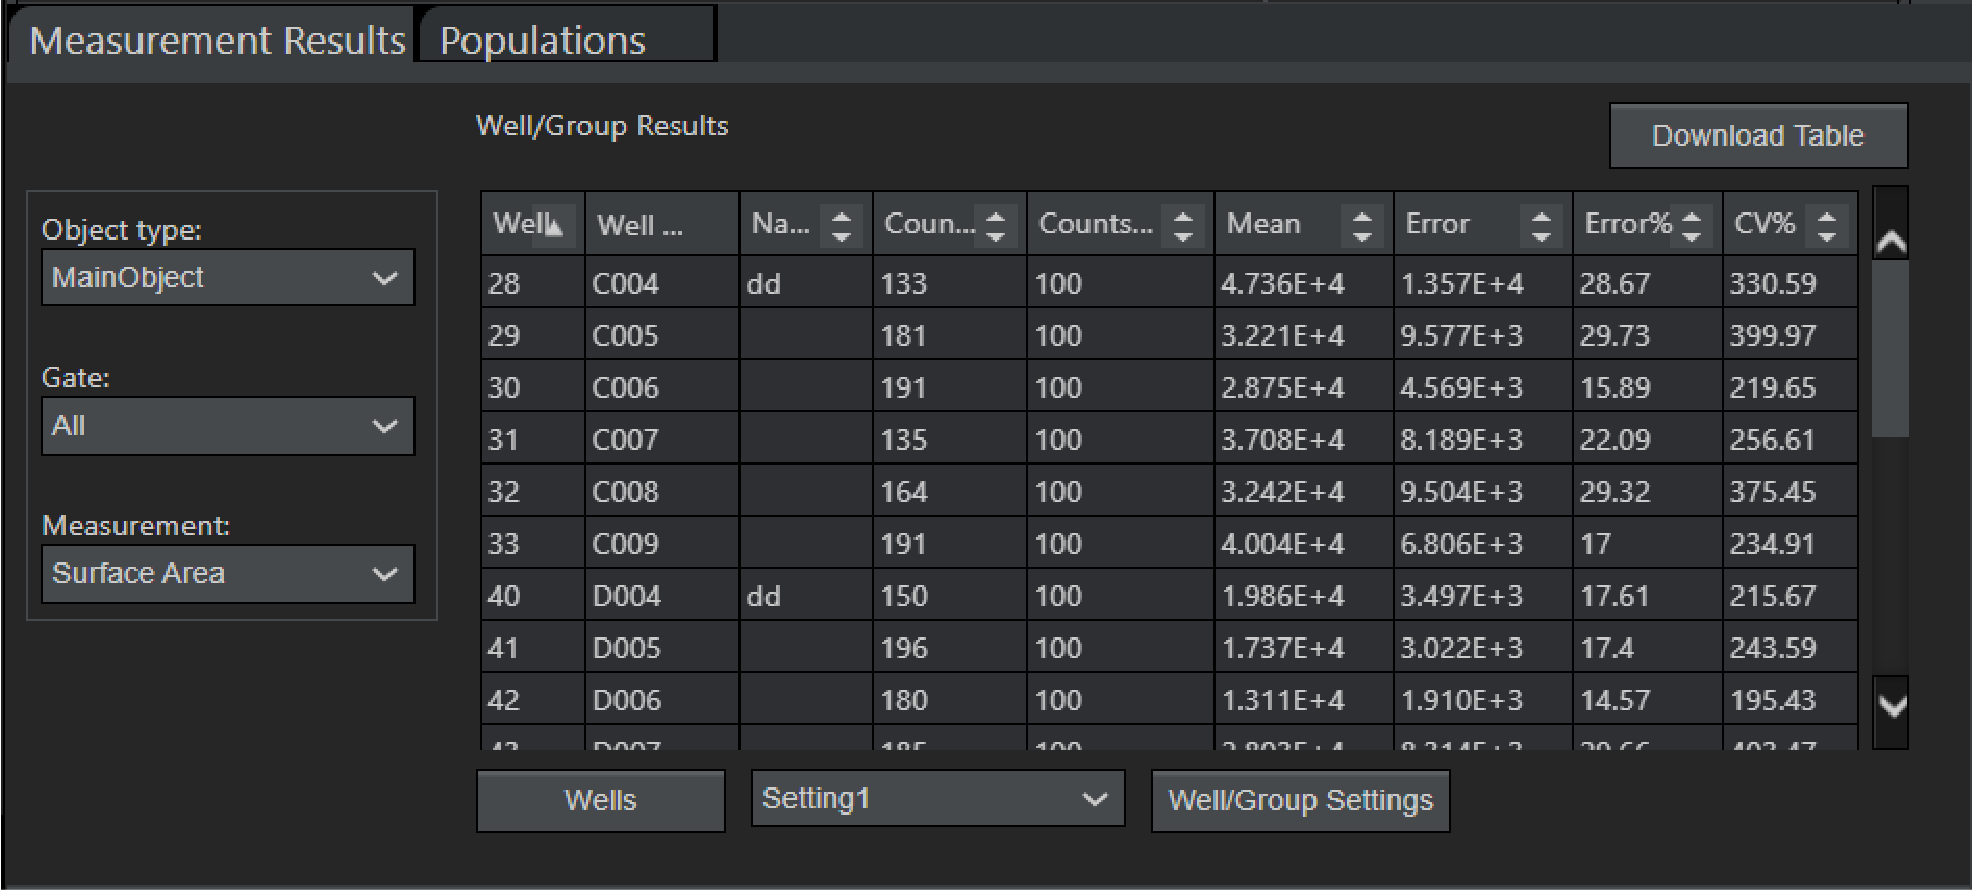
Data table showing average surface area values from each well.
Assay Settings and Reproducibility
Upon completion of data analysis, NoviSight software allows the user to save the settings as an “Assay.” These predetermined settings can then be applied to any other data sets containing similar imaging conditions and experimental parameters, such as the same samples imaged over multiple time points. This greatly reduces or eliminates user-induced variabilities in the data analysis.
Results
Organoid Size
Organoid surface area increased over time in all untreated organoid cultures, depicting organoid growth. 1 μM ST treatment saw a major decline in surface area as the drug killed organoids, inducing shrinkage. 50 μM IR treatment showed no significant increase in surface area, indicating complete growth inhibition, while 100 μM 5-FU treatments revealed only a minor increase in surface area suggesting that this drug was less effective than IR at suppressing organoid growth.
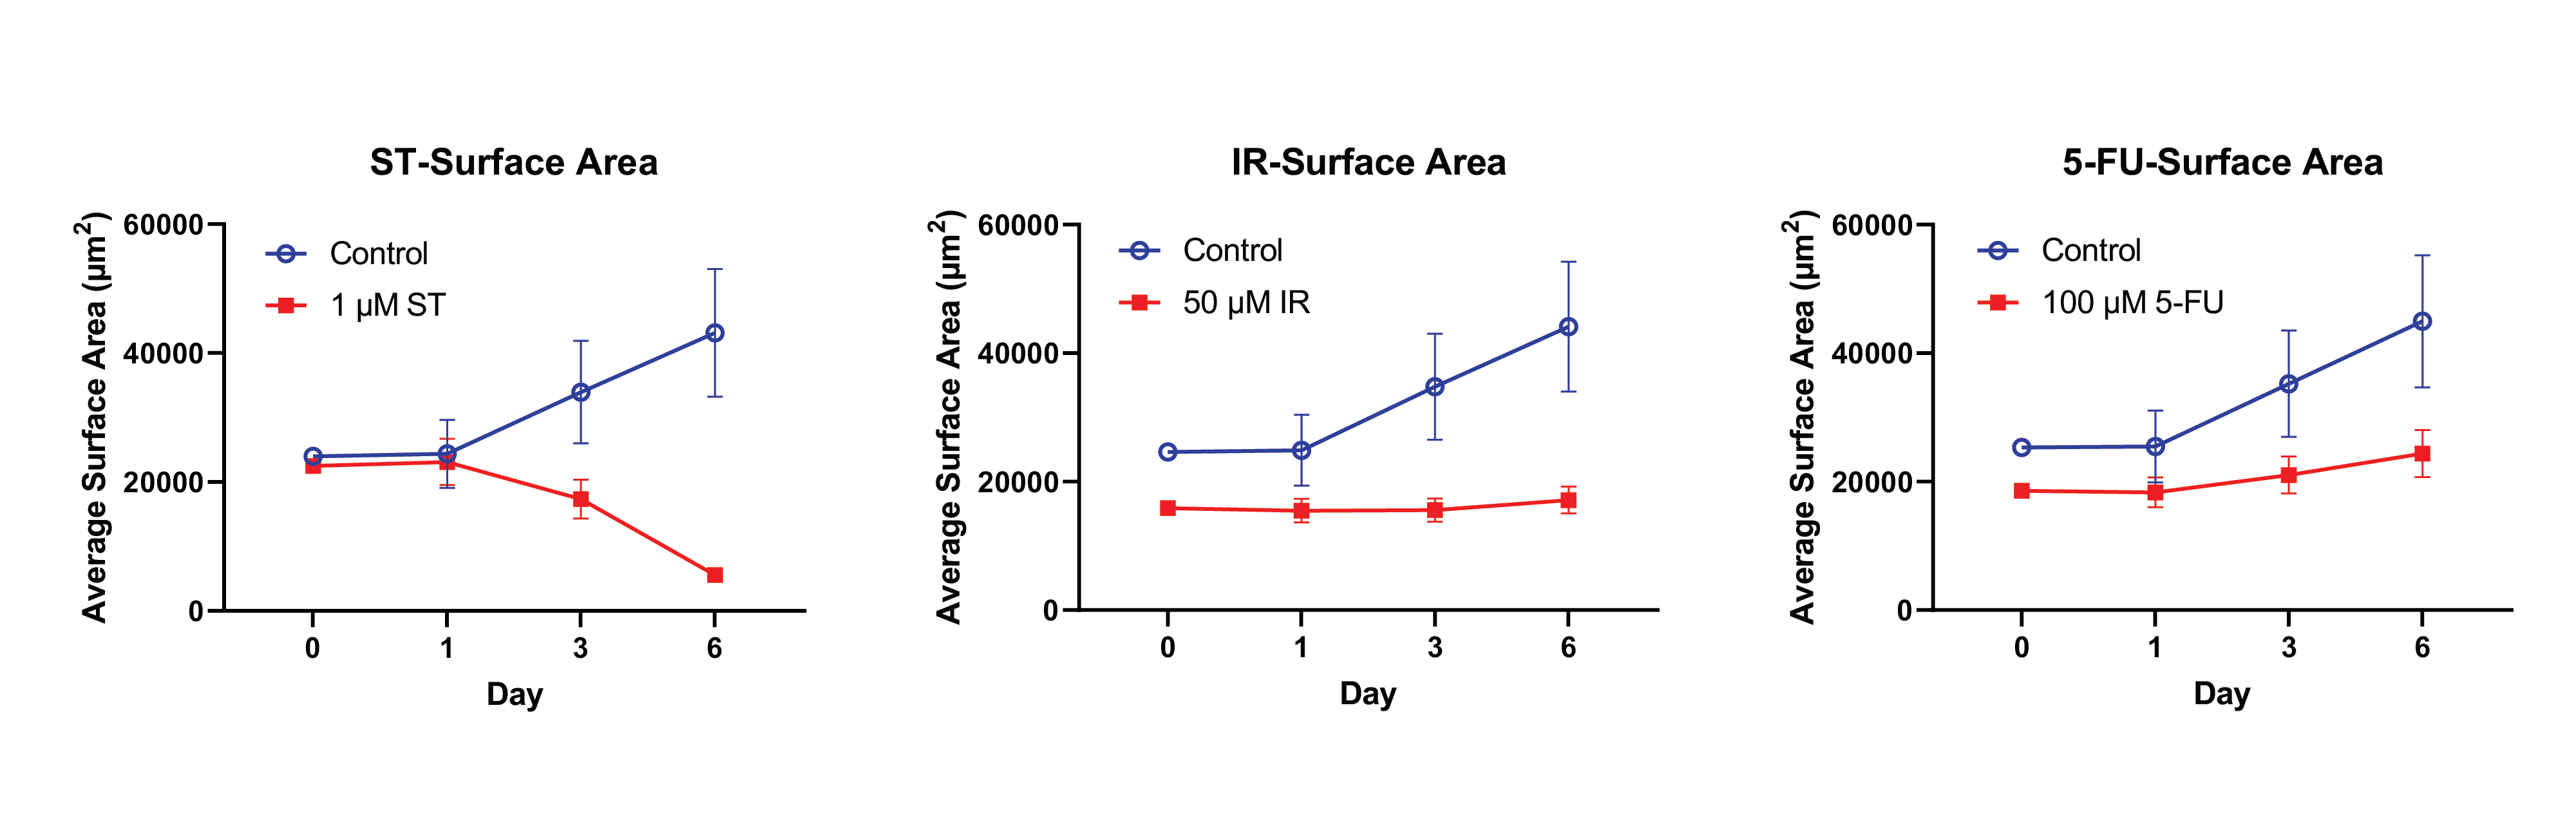
Changes of organoid surface area over time with no treatment, 1 μM ST, 50 μM IR, and 100 μM 5-FU treatments. (ST: control n=153, ST n=208), (IR: control n=184, IR n=241), (5-FU: control n=172, 5-FU n=183)
Organoid Morphology
Sphericity was measured to quantify the organoids’ morphological changes. Untreated controls exhibited decreasing sphericity over time. 1 μM ST treatment caused a late jump in the sphericity, indicating structural transitions associated with dying organoids. Sphericity measurements of 50 μM IR and 100 μM 5-FU treated organoids did not yield notable deviations from the controls, revealing minimal morphological changes.
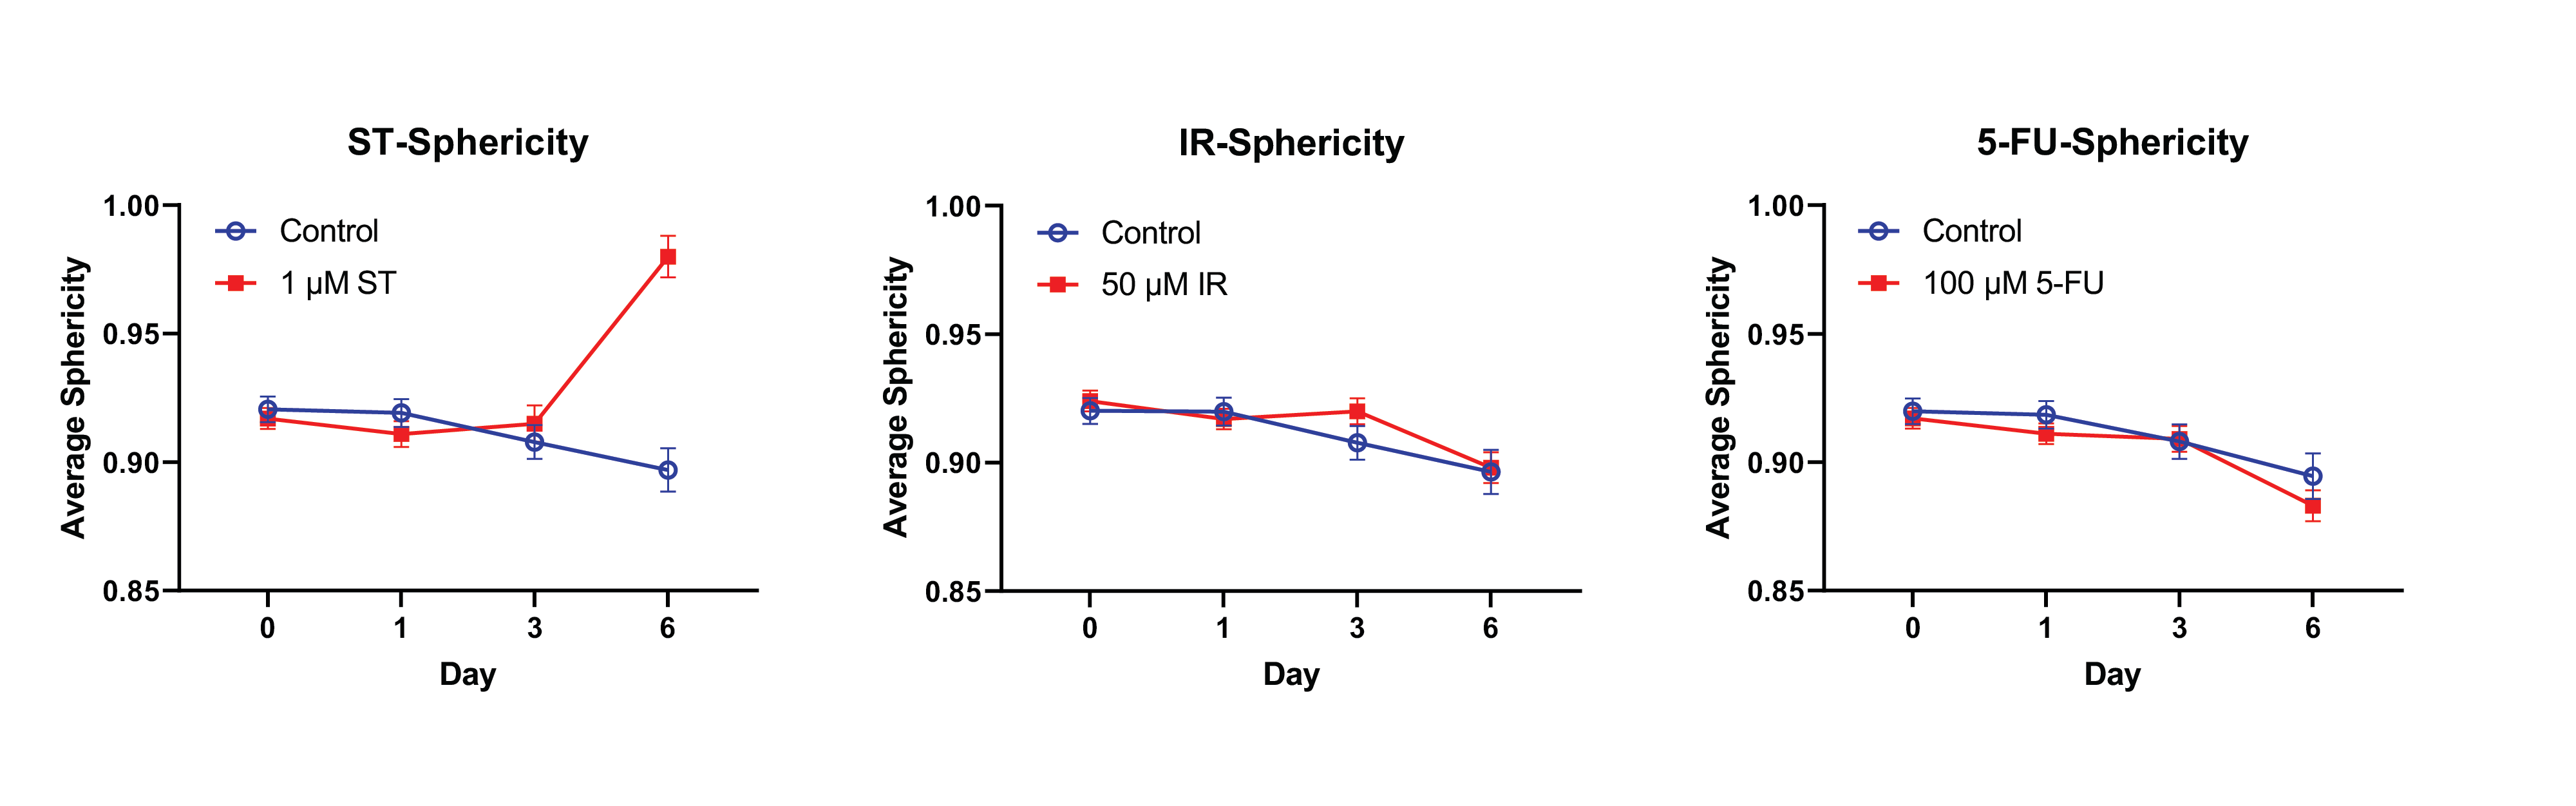
Changes of organoid sphericity over time with no treatment, 1 μM ST, 50 μM IR, and 100 μM 5-FU treatments.
Conclusion—Advantages of NoviSight Software for High-Throughput 3D Image Analysis
Using NoviSight software, we established a rapid and efficient 3D image analysis workflow. Interactive NoviSight features such as autogenerated heat maps and figures helped us visualize large volumes of data and identify trends at a glance. Practical features such as the segmentation preview and assay setting storage both expedite image analysis while simultaneously enabling the user to produce more consistent results. Using these elements of NoviSight software, we were able to measure seven morphological parameters (data shown for surface area and sphericity) of 3D organoids for three different drug treatments over four time points, ultimately enabling us to assess drug responses. These results demonstrate that NoviSight software can be used for high-throughput image analysis applications, such as drug screening.
Authors
- Brandon Choi, Seungil Kim, Jordan Gasho at Lawrence J. Ellison Institute for Transformative Medicine, University of Southern California
- Shohei Imamura, Strategic Project Manager, Olympus Corporation of the Americas
Verwendete Produkte
Sorry, this page is not
available in your country.