The discovery of fluorescent proteins and subsequent refinements in the genetic properties of these remarkable probes to generate a wide array of emission bandwidth profiles has extended the ability of biologists to visualize, track, and quantify molecular events in living cells with high spatial and temporal resolution. Fluorescent proteins derived from a variety of jellyfish, reef coral, and sea anemone species can be fused to virtually any protein or enzyme of interest in order to analyze protein geography, movement, lineage, and biochemistry in living cells. In this regard, these biological probes have provided an important new approach to understanding protein function, which is the next logical step for investigations of cellular processes now that the genome sequence of many organisms has been determined.
However, as useful as fluorescent proteins have been for investigations of sub-cellular targets and the functional properties of gene products in living cells, many applications designed to determine protein turnover rates or the analysis of temporal expression patterns are virtually impossible with conventional fluorescent proteins due to the fact that they are continuously being recycled (synthesized, folded, and subsequently degraded) within the cell. As a result, a large ensemble of proteins at different stages in their lifetime are being observed at any particular moment with the traditional fluorescent proteins that exhibit stable emission spectral profiles.
A simple approach to characterize protein expression timing or lifetime is to utilize destabilized fluorescent protein variants that can be readily differentiated by fluorescence intensity. Thus, a chimeric fluorescent protein that is rapidly turned over by proteolysis can be segregated into classes of younger, freshly synthesized fluorescent molecules, and older protein chimeras that have lost their fluorescence due to degradation of the chromophore. Unfortunately, the rapid decay of fluorescence results in very low signal levels, which presents a compromise between accurately monitoring protein dynamics and acquiring suitable digital images.
A more useful solution is to employ fluorescent proteins whose spectral properties change with time, illumination wavelength, or a similar variable that can be controlled by the investigator. One of the first and most basic examples of probes in this class is a fluorescent timer protein that was generated by random mutagenesis of a red-emitting coral reef fluorescent protein derived from Discosoma striata (first designated as mutant drFP583, but now commonly referred to as DsRed). Initially, the timer protein produces a green-emitting fluorophore (peak at 500 nanometers; similar to green fluorescent protein), but over a period of several hours, the fluorophore is slowly converted to a species that emits in the yellow-red spectral region (with a maximum at 580 nanometers). The advancing age of a chimeric protein fused with the timer moiety can be determined by a continual decrease in the observed ratio of green to red fluorescence. This ratio can then be used to gather temporal data for gene expression investigations.
Protein chromophores that can be activated to initiate fluorescence emission from a quiescent state (a process known as photoactivation), or are capable of being optically converted from one fluorescence emission bandwidth to another (photoconversion), represent perhaps the most promising approach to the in vivo investigation of protein lifetimes, transport, and turnover rates. Appropriately termed molecular or optical highlighters, photoactivated fluorescent proteins generally display little or no initial fluorescence under excitation at the imaging wavelength, but dramatically increase their fluorescence intensity after activation by irradiation at a different (usually lower) wavelength. Photoconversion optical highlighters, on the other hand, undergo a change in the fluorescence emission bandwidth profile upon optically-induced changes to the chromophore. These effects result in the direct and controlled highlighting of distinct molecular pools within the cell. Because only the limited population of photoactivated molecules exhibit noticeable fluorescence, their lifetime and behavior can be followed independently of other proteins that are newly synthesized. In a similar manner, fluorescent proteins that are capable of being optically modulated through photoconversion to reversibly alter emission intensity and/or color are also potentially very useful for examining dynamic processes in living cells.
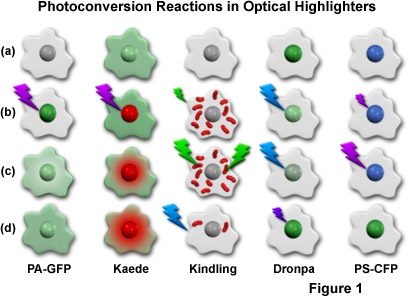
Presented in Figure 1 is a cartoon illustrating the photoconversion mechanisms for the most useful optical highlighters developed to date (and discussed in greater detail below). The activation or conversion sequence for each highlighter is outlined in a single column, with a repetitive cartoon drawing representing an individual cell containing a central nucleus being employed for each step in the sequence. Illumination at high intensities is indicated by large lightning bolts, while low intensity illumination is represented by smaller bolts. The fluorescence excitation wavelengths are similar to the colors of the lightning bolts, while the emission colors appear in the nucleus and/or cytoplasm of the cell cartoons. To examine a sequence, start with the uppermost cell drawing and proceed down the column. For example, a single cell containing photoactivatable green fluorescent protein (PA-GFP; described below) before conversion is illustrated at the top of the first column, and appears non-fluorescent (grayscale). After illumination of the nucleus with 405-nanometer light (purple lightning bolt; Figure 1(b)), the PA-GFP protein exhibits green fluorescence, which slowly diffuses into the cytoplasm, as illustrated by the lower two cell cartoons ((c) and (d)) in the first column. The other columns contain sequences that symbolize the photoconversion mechanisms for optical highlighters discussed in subsequent sections.
Discovering Optical Highlighters
Early efforts to produce a useful photoactivatable fluorescent protein met with relatively modest success. The first investigations on optical highlighters focused on wild-type green fluorescent protein (GFP) derived from the jellyfish Aequorea victoria, which absorbs predominately in the ultraviolet spectral region with a maximum centered around 395 to 400 nanometers. Illumination of the protein with violet light in the 400-nanometer region transforms the neutral phenolic chromophore into an ionic phenolate species that absorbs strongly with a maximum at 483 nanometers. The photoconversion reaction is mediated by decarboxylation of the glutamate residue at position 222 in the fluorescent protein backbone. Following intense irradiation with violet light, the relative intensities of green fluorescence produced by excitation at 395 and 488 nanometers can be monitored to track photoactivated wild-type GFP, albeit with some limitations. First, the dual excitation technique, although quantitative in principle, is not readily performed using most laser scanning confocal microscopes. A second drawback is that photoactivation of wild-type green fluorescent protein produces only a threefold increase in fluorescence emission intensity. Finally, the use of near-ultraviolet light for excitation is damaging to most living cells (especially when irradiated in the nuclear region) and raises the question of continued photoactivation during image acquisition.
The photoconversion of green fluorescent protein under anaerobic conditions to a species that emits wavelengths in the orange-red region (590-600 nanometers) is potentially useful for investigations of bacteria and yeast in low oxygen environments, but offers little utility in studies of cultured mammalian cells. The transition from green to red fluorescence emission occurs when oxygen-deficient GFP (either isolated or within intact organisms) is illuminated with relatively low doses of blue light from an arc-discharge lamp or laser source. Similar to the photoactivation of green fluorescent protein with ultraviolet light, the red fluorescence intensity produced by blue illumination of GFP in the absence of oxygen is relatively low. Furthermore, the effect diminishes quickly after returning to normal aerobic conditions.
Properties of Optical Highlighters
| Fluorescent Protein (Acronym-Color) | Excitation Maximum (nm) | Emission Maximum (nm) | Molar Extinction Coefficient | Quantum Yield | in vivo Molecular Structure | Relative Brightness (% of EGFP) | pKa |
|---|---|---|---|---|---|---|---|
| PA-GFP (G/NA) | 400 | 515 | 20,700 | 0.13 | Monomer | 8 | 4.5 |
| PA-GFP (G) | 504 | 517 | 17,400 | 0.79 | Monomer | 41 | - |
| PS-CFP (C) | 402 | 468 | 34,000 | 0.16 | Monomer | 16 | 4.0 |
| PS-CFP (G) | 490 | 511 | 27,000 | 0.19 | Monomer | 15 | 6.0 |
| PS-CFP2 (C) | 400 | 468 | 43,000 | 0.20 | Monomer | 26 | 4.3 |
| PS-CFP2 (G) | 490 | 511 | 47,000 | 0.23 | Monomer | 32 | 6.1 |
| PA-mRFP1 (R) | 578 | 605 | 10,000 | 0.08 | Monomer | 3 | 4.4 |
| Kaede (G) | 508 | 518 | 98,800 | 0.88 | Tetramer | 259 | 5.6 |
| Kaede (R) | 572 | 580 | 60,400 | 0.33 | Tetramer | 59 | 5.6 |
| Kikume (KikGR; G) | 507 | 517 | 53,700 | 0.70 | Tetramer | 112 | 7.8 |
| Kikume (KikGR; R) | 583 | 593 | 35,100 | 0.65 | Tetramer | 68 | 5.5 |
| wtEosFP (G) | 506 | 516 | 72,000 | 0.70 | Tetramer | 150 | - |
| wtEosFP (R) | 571 | 581 | 41,000 | 0.55 | Tetramer | 67 | - |
| dEosFP (G) | 506 | 516 | 84,000 | 0.66 | Dimer | 165 | - |
| dEosFP (R) | 569 | 581 | 33,000 | 0.60 | Dimer | 59 | - |
| tdEosFP (G) | 506 | 516 | 84,000 | 0.66 | Monomer | 165 | - |
| tdEosFP (R) | 569 | 581 | 33,000 | 0.60 | Monomer | 59 | - |
| mEosFP (G) | 505 | 516 | 67,200 | 0.64 | Monomer | 128 | 5.5 |
| mEosFP (R) | 569 | 581 | 37,000 | 0.62 | Monomer | 68 | 5.5 |
| Dendra (G) | 488 | 505 | 21,000 | 0.70 | Monomer | 44 | 6.6 |
| Dendra (R) | 556 | 575 | 20,000 | 0.72 | Monomer | 43 | 6.9 |
| Dendra2 (G) | 490 | 507 | 45,000 | 0.50 | Monomer | 67 | 6.6 |
| Dendra2 (R) | 553 | 573 | 35,000 | 0.55 | Monomer | 57 | 6.9 |
| Kindling (R) | 580 | 600 | 59,000 | 0.07 | Tetramer | 12 | - |
| Dronpa (G) | 503 | 518 | 95,000 | 0.85 | Monomer | 240 | 5.0 |
Table 1
During experiments designed to explore the use of DsRed and several derivatives as optical highlighters in multiphoton imaging, investigators discovered that exposure to femtosecond pulsed laser illumination at wavelengths less than 760 nanometers shifted the emission color of the coral reef fluorescent protein from red to green. The mechanism of this transition is thought to be linked to a reduction of fluorescence resonance energy transfer (FRET) occurring within the protein tetramer due to photobleaching of the red emission from the mature form of the protein, thereby enhancing green emission from the immature species. Referred to as the greening effect, this phenomenon appears to be complex and depends on the maturation efficiency of DsRed. An advantage of multiphoton excitation is the ability to specifically localize the photoconversion of DsRed within selected volume areas (voxels), but the technique requires specialized and expensive equipment (a femtosecond Ti:Sapphire laser) not available in many laboratories. Furthermore, the tendency of coral reef proteins (including DsRed) to form obligate tetramers in vivo often compromises the ability of these probes to participate in the formation of biologically functional chimeras.
In a technique related for fluorescence recovery after photobleaching (FRAP) and fluorescence loss in photobleaching (FLIP), a target chimeric protein fused to two different fluorescent proteins is selectively bleached to extinguish fluorescence from one fluorophore while enabling the other to serve as a reference label. Termed fluorescence localization after photobleaching (FLAP), the method is comparable to photoactivation due to its ability to selectively track fused chimeric fluorescent proteins in living cells. The pilot studies were conducted using fusion constructs of beta-actin with enhanced yellow and cyan fluorescent proteins to simultaneously track both the fast relocation dynamics of monomeric (globular) G-actin and the much slower dynamics of filamentous F-actin in adherent fibroblasts. This technique shows promise for many applications, but requires almost identical expression levels of each chimera in co-transfected cells, a drawback that might complicate biologically complex investigations.
The approaches described above can be successfully applied under certain circumstances to investigations of protein tracking and dynamics using fluorescent proteins. However, each technique has serious limitations that preclude its widespread application to the basic studies necessary for monitoring many of the processes in living cells. Specifically, several of these optical highlighters are limited by their poor fluorescence emission intensity and instability of the photoconverted product. Further restrictions are enforced by the unavailability of simple, efficient, and specific illumination techniques for photoconversion of the proteins.
The ideal optical highlighter proteins should be readily photoconvertible (through the process of fluorescence activation and/or emission wavelength shifts) to produce a high level of contrast, as well as being monomeric for optimum expression in the target system. These probes will be especially useful in experiments paralleling results obtained with photobleaching techniques, such as recovery (FRAP) and loss (FLIP) of photobleaching, because they have the advantage that measurements are not influenced by newly synthesized or non-converted proteins, which either remain invisible or continue to emit the original wavelengths. Also, by repeated excitation in the region of interest, optical highlighters can be continuously photoconverted at a specific intracellular location. This technique is more efficient than FLIP because the translocation of activated proteins can be directly imaged. In addition, the time required for photoactivation (a few seconds) is often much less than the time required to completely photobleach a similar region. Investigations involving extremely rapid cellular processes will clearly benefit from such improvements in temporal resolution.
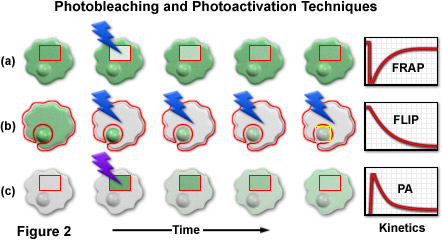
A series of cartoon drawings (depicting typical cells with a nucleus and cytoplasm) that compare the most common photobleaching and photoactivation techniques is illustrated in Figure 2. Bleach and activation regions are outlined with red boundaries, and lightning bolts represent optical bleaching or photoactivation events. The areas marked in red are also utilized for quantitative analysis of the kinetic parameters plotted in the graphs on the right-hand side of the figure. In a typical FRAP experiment (Figure 2(a)), a selected region (inside the rectangular box) is illuminated with a burst of high-intensity blue light to photobleach all of the fluorescent molecules. After the bleaching event, new proteins slowly diffuse into the region, restoring the fluorescence intensity as the cell returns to a steady state (plotted on the graph). FLIP, as illustrated in Figure 2(b), is similar to FRAP except that the entire contents of the cell are repeatedly photobleached with the exception of a small region of interest (in this example, the nucleus). As the bleaching cycles progress, fluorescent proteins in the nucleus diffuse into the cytoplasm where they are subsequently bleached. In photoactivation (Figure 2(c)), the selected area is illuminated with high-intensity violet light to induce fluorescence emission in the optical highlighter protein. As the photoactivated optical highlighter diffuses through the cytoplasm and nucleus, the fluorescence intensity decreases inside the selection boundaries. A related technique, termed inverse fluorescence recovery after photobleaching (iFRAP; not illustrated) produces results similar to photoactivation, but requires bleaching of the entire cellular contents outside of the selected region.
Presented in Table 1 is a compilation of important data for fluorescent proteins that display significant potential in applications as in vivo probes targeting cellular structure and function. Included are the excitation (or absorption) and fluorescence emission maximum wavelengths for both the activated and non-activated species, as well as the molar extinction coefficients, quantum yields, molecular structure (monomer, dimer, tetramer, etc.), and relative brightness level compared to enhanced green fluorescent protein (EGFP). Also listed are the reported pKa values, which reveal the comparative stability of the emission spectra for the optical highlighter proteins in acidic environments. This table should serve as a convenient guide for comparing the properties of optical highlighters.
Photoactivatable Green Fluorescent Protein (PA-GFP)
The first useful optical highlighter designed specifically for photoactivation studies is a variant of the jellyfish (Aequorea victoria) green fluorescent protein, termed PA-GFP (using the initials to create an acronym from Photo and Activatable). This photoactivatable version of GFP was developed by improving on the photoconversion efficiency of the natural wild-type protein chromophore from a predominately neutral form to a species that is anionic in character. The primary target for the site-directed mutations is a single amino acid residue, the threonine located at position 203 in the wild-type chromophore, which can be modified by substitution with any one of several amino acids to decrease the initial absorbance at 475 nanometers while still permitting photoactivation. In particular, mutation of this residue to histidine (the PA-GFP variant) results in a dramatic extinction coefficient increase of the absorption spectral profile in the blue-cyan region (centered at 504 nanometers) when the protein is activated by being illuminated with ultraviolet or violet light in the range between 360 and 420 nanometers.
In the unperturbed state, the wild-type green fluorescent protein chromophore contains a mixed population of neutral phenols and anionic phenolates (as described above), which collectively give rise to bimodal major and minor absorption maxima at 395 and 475 nanometers, respectively. These peaks have a magnitude ratio of approximately six to one. When the protein is illuminated with high-intensity ultraviolet or violet light, however, the chromophore population undergoes photoconversion and shifts predominately to the anionic form, reversing the relative extinction coefficient ratio of the major and minor absorption peaks. The result is an increase in fluorescence emission intensity of about threefold upon excitation of the chromophore at 488 nanometers. PA-GFP was specifically designed with the intention of decreasing the minor absorption peak at 475 nanometers while simultaneously enhancing the wild-type photoconversion efficiency under violet illumination (approximately 400 nanometers). The histidine residue substitution at position 203 fulfills this requirement by producing a variant with negligible absorbance in the region between 450 and 550 nanometers, thus dramatically enhancing the contrast between the non-activated and activated species.
After photoactivation with violet light, the absorption maximum at 504 nanometers in PA-GFP increases approximately 100-fold. This event evokes very high contrast differences between the converted and unconverted pools of PA-GFP, and is useful for tracking the dynamics of molecular subpopulations within a cell (see the sequence in Figure 1). Note that after photoactivation, both PA-GFP and the wild-type GFP exhibit comparable levels of fluorescence when illuminated with a 488-nanometer laser. On the downside, intracellular targets expressing PA-GFP are not readily distinguishable before photoconversion without the use of a low intensity violet illumination source (such as a 405-nanometer blue diode laser), making it difficult to identify the proper regions to be selectively targeted in photoactivation experiments using microscopes having only blue and green lasers. Furthermore, the interactions between optically labeled and unlabeled proteins cannot be easily observed in these confocal microscopes.
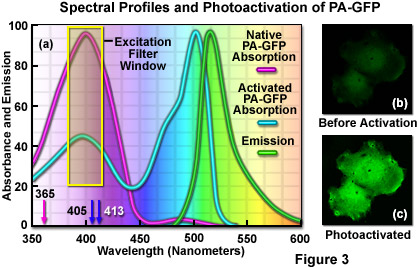
In practical applications, photoactivation and imaging requirements are the primary concern when using PA-GFP to highlight molecular events. Once the protein is activated, the excitation and emission maxima of PA-GFP are shifted to longer wavelengths by a few nanometers compared to EGFP, but similar filter sets should be useful for both probes (see Figure 3(a)). The negligible fluorescence emission of PA-GFP prior to photoactivation can be overcome by imaging targets containing the molecule using low levels of illumination in the 360 to 420 nanometer range. These bandwidths can be achieved using violet excitation filters in widefield microscopes, as well as near-ultraviolet and violet lasers in confocal instruments. The resulting native PA-GFP green fluorescence is very dim, but usually sufficient to locate positive cells and structures (Figure 3(b)). Note that care must be taken to minimize the exposure time during preliminary observations in order to avoid premature photoactivation (thus reducing the contrast for imaging experiments). Alternatively, co-transfection with a stable cyan or red fluorescent protein vector can be used to locate cells harboring the PA-GFP probe.
Illustrated in Figure 3(a) are the absorption and emission spectral profiles for PA-GFP before and after photoactivation. Also depicted in the figure are the laser wavelengths (arrows) and widefield arc-discharge lamp excitation window (yellow box) utilized to photoactivate the protein. The emission profile presented in Figure 3(a) is that observed upon illumination of the activated protein with a 488-nanometer laser system. Excitation of the protein to locate target areas can be accomplished with a 405-nanometer diode laser at low power (Figure 3(b)). After photoactivation (Figure 3(c)), the fluorescence emission intensity in the green visible spectral region increases dramatically.
The photoactivation of PA-GFP can be employed to rapidly mark a selected population of molecules (or entire cells), which can then be monitored for kinetic properties with time-lapse image sequences in widefield and confocal microscopy. Because phototoxicity due to irradiation at near-ultraviolet and violet wavelengths can hamper some investigations, multiphoton excitation at 780 to 840 nanometers should be a useful alternative if the necessary equipment is available. Under ideal conditions, only photoactivated PA-GFP molecules exhibit noticeable fluorescence, eliminating any concern that newly synthesized proteins will become fluorescent and compromise the experiment, an artifact of primary concern when investigating protein dynamics by traditional photobleaching methods. Furthermore, photoactivation of PA-GFP is capable of generating a population of highlighted proteins more rapidly and with greater optical enhancement than selectively photobleaching outside a similar population of enhanced green fluorescent protein molecules. The rapid and sizable optical enhancement obtained by using PA-GFP photoactivation, therefore, renders this technique uniquely suited for analyzing protein kinetics within living cells.
Advanced genetic engineering strategies have been applied to develop new photoactivatable variants using site-directed mutagenesis of monomeric red-shifted reef coral fluorescent proteins. In particular, the monomeric derivative of DsRed fluorescent protein, mRFP1, has been converted into probes that are photoactivated by either green or violet irradiation. These have been collectively termed PA-mRFP1s, the brightest of which exhibits a 70-fold increase of fluorescence intensity upon activation by wavelengths between 380 and 400 nanometers. The critical molecular determinant residues for producing photoactivatable proteins with coral reef variants appear to be the amino acids at positions 146, 161, and 197 (DsRed numbering scheme). These residues, which lay in close proximity to the chromophore, serve to stabilize the tyrosine residue at position 66 in either a cis (fluorescent) or trans (non-fluorescent) configuration to form a fluorescent protein (cis) or a chromoprotein (trans) that absorbs light but does not emit fluorescence.
Site-directed mutagenesis of the three amino acids into variants capable of regulating isomerization states through light-induced trans-cis switching is the underlying mechanism for creating photoactivatable fluorescent proteins in this class. The monomeric red fluorescent protein optical highlighter has been demonstrated to be useful in some cases as a fusion tag in mammalian systems for investigation of intracellular dynamics. However, the relatively low level of fluorescence of PA-mRFP1s in the photoactivated form (3 percent of EGFP), along with a tendency to form non-specific aggregates when fused to naturally oligomeric proteins (for example, actin and tubulin), render these probes less useful than PA-GFP for live-cell investigations. Improved monomeric yellow, orange, and red fluorescent proteins (such as mCherry, mStrawberry, and mPlum) hold the potential to produce efficient photoactivatable optical highlighters with emission wavelengths extending into the deep red portion of the visible light spectrum.
Additional Aequorea Jellyfish Optical Highlighters
Several potentially useful optical highlighter probes have been derived from aceGFP, the most efficient green fluorescent variant of a colorless Aequorea coerulescens protein known as acGFPL. Random mutagenesis of wild-type acGFPL has generated several green fluorescent protein derivatives containing, among other mutations, a glycine in place of the evolutionarily invariant glutamic acid residue at position 222 in the polypeptide backbone. The derivative exhibiting the highest level of green fluorescence emission has been named aceGFP to differentiate its source from proteins in the A. victoria family. Aside from the potential utility of aceGFP as a useful biological tool similar to EGFP, re-introduction of glutamic acid at position 222 converts this derivative into a colorless protein (aceGFP-G222E) with potential as a photoactivation highlighter.
The absorption spectral profile of aceGFP-G222E features a maximum having a high extinction coefficient at 280 nanometers and a second, minor peak at 390 nanometers. Irradiation of the protein with ultraviolet light in the range between 250 and 300 nanometers results in the appearance of a new absorption profile having a maximum at 480 nanometers. Because this transition to blue absorption is not accompanied by a decrease in the 390 nanometer peak extinction coefficient, investigators have speculated that the conversion originates from an immature, spectrally undetectable species. Excitation of photoactivated aceGFP-G222E at 488 nanometers generates green fluorescence with a maximum emission wavelength at 505 nanometers and high quantum yield (0.45), producing an approximate 1000-fold increase in fluorescence intensity.
Unfortunately, the rather substantial optical and biological requirements for photoactivation of aceGFP-G222E (ultraviolet light below 300 nanometers in wavelength) precludes the widespread use of this probe for live-cell imaging experiments due, in part, to the potentially damaging radiation effects. In addition, most microscopes do not have optical trains that can efficiently transmit light in the wavelength region below 360 nanometers. Discounting the obvious current limitations, the photoconversion of aceGFP-G222E from a colorless immature species into a protein that absorbs light in the blue spectral region is a novel phenomenon that certainly merits further investigation. Additional modifications of this and related proteins from Aequorea may provide a new class of optical highlighters similar in properties to PA-GFP.
Another novel photoconversion optical highlighter, termed photoswitchable cyan fluorescent protein (PS-CFP), derived from the Aequorea coerulescens green fluorescent protein variant, aceGFP, has been observed to transition from cyan to green fluorescence upon illumination at 405 nanometers (as illustrated in column 5 of Figure 1). The PS-CFP highlighter was generated by site-directed mutagenesis of aceGFP. Expressed as a monomer in vivo, this probe should be useful in photobleaching, photoconversion, and photoactivation investigations because it can potentially be fused to a wide variety of proteins without altering their behavior. Another advantage of PS-CFP is the significant level of cyan fluorescence that is present before photoconversion, a factor that allows investigators to track and selectively illuminate specific intracellular regions or entire cells for study. However, the fluorescence emission intensity from PS-CFP is approximately 2.5-fold dimmer than PA-GFP, and the probe is inferior to other highlighters in terms of photoconversion efficiency (the 40-nanometer wavelength shift in fluorescence emission upon photoconversion is less than that observed with similar optical highlighters).

Presented on the left-hand side of Figure 4 are the absorption and fluorescence emission spectral profiles for PS-CFP before and after photoconversion. The native and photoconverted PS-CFP protein absorption spectra (maxima at 402 and 490 nanometers, respectively) are indicated by dashed lines, while the emission spectra (respective maxima at 468 and 511 nanometers) are noted with solid lines. The digital image cellular (opossum kidney) tracking sequence illustrated in Figures 4(a) through 4(d) was captured using a high-contrast, brighter variant of PS-CFP, termed PS-CFP2, which is commercially available as a cloning vector. PS-CFP2 was derived by site-directed mutagenesis of PS-CFP to replace three residues in the polypeptide backbone, leading to much faster maturation and brighter fluorescence (see Table 1). The ability of PS-CFP and PS-CFP2 to endure low pH levels enables targeting of these probes to acidic organelles such as the endosomes and lysosomes. The central cell in Figure 4(a) was selected and illuminated with a 405-nanometer diode laser at high power to induce photoconversion (Figure 4(b)), and then imaged over a period of several hours (Figures 4(c) and 4(d)). Continued biosynthesis native of PS-CFP2 in the cytoplasm eventually shifts the color of the photoactivated cell to cyan as the ratio of non-converted to converted protein increases.
Regardless of the minor drawbacks, PS-CFP is useful for high-contrast protein labeling and has been successfully employed in dual-color ratiometric imaging experiments, including (for the first time) the direct visualization of cargo exchange between two endosomes. In addition, the high level of contrast between the native and photoactivated species is more pronounced than that of either PA-GFP or the kindling fluorescent protein (KFP-1), but is on the same scale as Kaede (the latter two highlighters are discussed below). Following exposure to intense 405-nanometer light, PS-CFP undergoes a 5-fold decrease in cyan fluorescence with a concurrent 300-fold increase in green fluorescence, resulting in an optical contrast ratio of approximately 1500-fold (increased to 2000-fold in PS-CFP2). This relatively high degree of contrast triggered by photoactivation, along with the lack of aggregation in vivo, should enable the resolution of subtle features in protein trafficking without artifacts induced by self-association of the probe. Another useful feature of PS-CFP is the ability to visualize and record digital images of the probe using the popular enhanced cyan fluorescent protein (ECFP) and standard fluorescein (FITC) fluorescent filter combinations. PS-CFP can also be employed, at low to moderate excitation intensities, as a pH-stable cyan label for routine investigations of cellular dynamics and fluorescence resonance energy transfer experiments with other fluorescent protein acceptors.
The excitation maximum at 402 nanometers for PS-CFP suggests that the chromophore is neutral during photon absorption. However, unlike the situation for traditional protonated green fluorescent protein derivatives, where a phenomenon known as excited-state proton transfer (ESPT) occurs prior to green photon emission, PS-CFP emits photons in the cyan portion of the visible light spectrum (maximum at approximately 468 nanometers). The transfer rate of excited state protons may be reduced in this probe due to modifications of the proton transfer network by the chromophore environment. However, it is interesting to note that intense irradiation with ultraviolet or violet light produces an irreversible transformation from the protonated to de-protonated species by the same mechanism for wild-type GFP. These results suggest that the regulation of ESPT, an effect common to almost all fluorescent proteins, should of primary concern when designing new fluorescent protein candidates for photoconversion.
Among the potential problems with PS-CFP is that, unlike many of the optical highlighters that require a different wavelength for photoactivation and subsequent imaging of the converted species, PS-CFP uses the same wavelength at different intensities for both processes. As a result, simultaneous tracking of the cyan and green signals in a mixture of photoconverted and non-activated PS-CFP often results in continued activation by the violet laser (even at the relatively low light levels necessary for imaging). This artifact can be avoided, in many cases, by imaging only the green fluorescence of the photoconverted species. In addition, PS-CFP is slightly more sensitive to photobleaching than enhanced green fluorescent protein, which could present problems in certain experiments. Ratiometric imaging experiments with PS-CFP should be approached with caution because the excitation wavelength of the cyan component overlaps with the photoconversion wavelength, requiring careful balancing of the light sources. Finally, separating the cyan and green emission spectra for PS-CFP is more difficult than separating green from red emission in other optical highlighters. Additional mutagenesis efforts on this and related fluorescent protein families have a significant potential to yield many new useful variants in the cyan wavelength region.
Non-Aequorea Photoactive Fluorescent Proteins
A variety of interesting and potentially useful optical highlighters have been developed in fluorescent proteins cloned from reef coral and sea anemone species. One of the first and most important examples, a tetrameric fluorescent protein isolated from the stony Open Brain coral, Trachyphyllia geoffroyi, has been found to photoconvert from green to red fluorescence emission in the presence of ultraviolet light. It is interesting to note that the discovery of this highlighter occurred when researchers accidentally left a test tube containing the protein on a laboratory bench near a window, and then astutely observed the shift from green to red. The unusual color transition prompted investigators to name the protein Kaede, after the leaves of the Japanese maple tree, which turn from green to red in the fall months. The original Kaede protein was isolated by creating a complementary DNA library and screening for fluorescent bacterial transformants. Unlike the case for PS-CFP, the photoconversion of fluorescence in Kaede occurs by absorption of light that is spectrally distinct from the illumination band necessary for imaging (see column 2 of Figure 1). Irradiation of the Kaede optical highlighter with light between 380 and 400 nanometers results in a rapid spectral shift from principal maxima at 508 nanometers (absorption) and 518 nanometers (emission; see Figure 5) to longer wavelength peaks at 572 and 582 nanometers, respectively.
Upon photoconversion, Kaede exhibits a dramatic increase in the red-to-green fluorescence ratio (approximately 2000-fold, considering both the decrease in green and the increase in red emission). The conversion is stable and irreversible under aerobic conditions, and neither exposure to dark for extended periods nor is strong illumination at 570 nanometers able to restore green fluorescence to the chromophore. The red fluorescent state of the Kaede chromophore is comparable to the green in terms of brightness and stability, and because the unconverted protein emits very little fluorescence above 550 nanometers, the appearance of strong red signal provides excellent contrast. Similar proteins capable of being photoconverted by violet and ultraviolet illumination have been discovered in the Great Star coral (mcavRFP; derived from Montastraea cavernosa), soft corals (DendFP; derived from members of the genus Dendronephthya), and the mushroom coral (rfloRFP; derived from Ricordea florida). All of these highlighters (including Eos, discussed below) contain a chromophore derived from the tripeptide His-Tyr-Gly that initially forms green fluorescence until driven to a red state by light rather than chemical oxidation, as is the case with many red fluorescent proteins derived from reef corals. The unique color transition properties in this class of optical highlighters render the probes excellent candidates for optical labeling of sub-cellular organelles or even entire cells. Furthermore, when observed in confocal microscopy using spectral imaging detector systems, shifts in the green-to-red fluorescence emission ratio in specific cells can be employed to define separate image channels for individual monitoring and screening purposes.
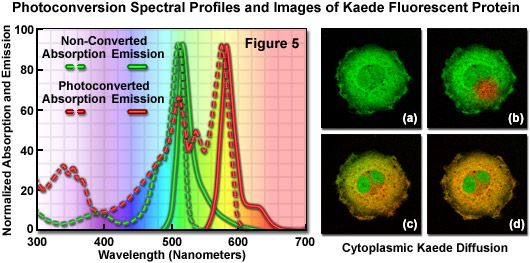
Presented in Figure 5 are the absorption and fluorescence emission spectral profiles of natural and photoconverted Kaede, along with a series of images of non-fused Kaede fluorescent protein (lacking a sub-cellular localization partner) diffusing throughout the cytoplasm of an isolated opossum kidney epithelial cell. The non-converted Kaede absorption and emission spectral profiles are outlined in the graph with green dots and dashes, respectively, while the photoconverted Kaede profiles are denoted with red dots and dashes. Note the relatively small Stokes shift (approximately 10 nanometers) for both pairs of spectra, but the large separation distance (60 nanometers) between the green and red emission maxima. The digital image sequence (Figures 5(a) through 5(d)) illustrates the green fluorescence emission from Kaede before photoconversion (Figure 5(a)), and shortly after illumination of a selected region with a 405-nanometer diode laser (the red area in Figure 5(b)). Photoconverted Kaede slowly diffuses throughout the cytoplasm of the cell (Figures 5(c) and 5(d)), but does not enter the twin nuclei. When imaged over longer periods of time, continued biosynthesis of the Kaede protein shifts the overall color of the cytoplasm from orange-red to yellow-green as the ratio of native to converted Kaede slowly increases.
Based upon the analogy with PA-GFP and the fact that activation is facilitated by a slightly acidic environment, investigators have speculated that the Kaede protein chromophore most likely undergoes photoconversion upon irradiation of the protonated (as opposed to the neutral) species with ultraviolet or violet light. When illumination in the 365 to 400 nanometer range is utilized, the photoconversion kinetics are rapid (exhibiting a half-life of approximately 30 seconds). However, as the irradiating wavelength is increased towards the blue-violet region (440 nanometers) the conversion rate drops dramatically, and ultimately ceases entirely at 470 nanometers and above (although a gradual decrease in green emission intensity is still observed).
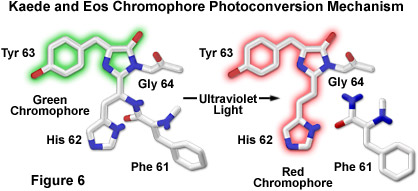
The proposed mechanism driving photoconversion in the Kaede chromophore centers around the histidine-tyrosine-glycine tripeptide positioned at residues 62-64 in the peptide backbone. These amino acids form the imidazolinone chromophore (similar to the Aequorea proteins) that is transformed from green to red fluorescence emission under illumination at shorter visible and longer ultraviolet wavelengths. Irradiation induces cleavage between the amide nitrogen and alpha carbon atoms in the histidine residue with subsequent formation of a highly conjugated dual imidazole ring system, a process requiring catalysis by the intact protein and resulting in the dramatic shift of fluorescence emission (to red wavelengths; see Figure 6). The unconventional chemistry involved in this chromophore transition should serve fluorescent protein engineers with an excellent foundation upon which to develop more advanced optical highlighters.
Fluorescent proteins having properties similar to Kaede have been isolated from other coral reef species, as discussed above. For example, the stony coral Favia favus has yielded a promising tetrameric derivative that exhibits efficient photoconversion from green to red fluorescence emission wavelengths upon irradiation with near-ultraviolet or violet light. Genetic engineering efforts based on structural analysis of this protein produced a variant, termed KikGR (named after Kikume-ishi, the Japanese term for Favia) that is several-fold brighter than Kaede in both the green and red states when expressed in mammalian cells. Commercially available under the name Kikume Green-Red, the optical highlighter has been demonstrated to be successfully photoconverted using multiphoton excitation at 760 nanometers, which can be used for specific labeling of cells with high spatial discrimination in thick tissues. Furthermore, the Kikume highlighter features a wider separation of green and red emission maxima (75 nanometers) than Kaede.
Another unique highlighter that undergoes green-to-red photoconversion has been isolated from the soft coral Dendronephthya and named Dendra (an acronym derived from the first four letters of the genus name, Dend, and red activatable). Originally isolated as a tetramer, Dendra was converted into a true monomer through site-directed mutagenesis to yield a green fluorescent probe that can be photoconverted into a red species using either ultraviolet or blue light. Upon photoconversion, Dendra exhibits up to a 4000-fold increase in red fluorescence and demonstrates remarkable photostability. Unlike many of the Aequorea protein variants, maturation of the Dendra green chromophore is very efficient over a wide temperature range, from 20 to 37 degrees Celsius. A commercial version, Dendra2, contains the substitution of a single amino acid, valine for alanine, at position 224 (A224V), which leads to more complete maturation and brighter fluorescence both before and after photoconversion. The ability to photoconvert Dendra using a 488-nanometer laser at high intensity is distinctive in that other green-to-red optical highlighters require more phototoxic ultraviolet or violet (405-nanometer) light. However, caution should be used when adjusting the laser for imaging Dendra at 488 nanometers to avoid unwanted photoconversion.
Among the advantages of using the proteins in the Kaede family as optical highlighters is the large separation in peak wavelengths between the absorption bands required for efficient photoconversion and subsequent observation (between 60 and 75 nanometers), enabling the application of several lasers for conducting experiments. For example, following irradiation with a 405-nanometer blue diode laser to induce photoconversion, image acquisition can be readily accomplished with an argon-ion laser at 488 nanometers and a green or yellow helium-neon laser operating at 543 or 594 nanometers, respectively. Note that none of the observation wavelengths will induce further photoconversion in the highlighters. Although regions of interest are easily selected for photoconversion and observation using a confocal microscope, the proteins can also be imaged with a traditional widefield fluorescence microscope equipped with the proper filter combinations. On the downside, many of the reef coral and anemone proteins are obligate tetramers, including the primary Kaede derivatives, which results in a tendency to form aggregates when the highlighters are fused to other proteins. In many cases, this artifact will limit the use of Kaede and its relatives to bulk cytoplasmic investigations of cell tracking. Further genetic engineering efforts involving tetrameric stony coral optical highlighters may ultimately yield monomeric derivatives that are useful in fusion constructs, as discussed below.
Reef Coral Eos Fluorescent Protein
Another tetrameric stony coral (Lobophyllia hemprichii) fluorescent protein similar to Kaede, termed EosFP (named after Eos, the goddess of dawn in Greek mythology; see Table 1), emits bright green fluorescence at 516 nanometers that shifts to orange-red (581 nanometers) when illuminated with ultraviolet light at wavelengths in the near-ultraviolet region of 390 nanometers. In this case (as with the Kaede protein discussed above), the spectral shift is produced by a photo-induced modification involving a break in the peptide backbone adjacent to the chromophore. Two single point mutations have been employed to split the wild-type tetramer into dimer subunits, each of which are capable of being incorporated into functional fusion constructs with a variety of proteins that retain normal biological functions. In addition, a tandem dimer (tdEos) variant has bee produced that contains two copies of the fluorescent protein sequence separated by a 12-amino acid linker. The tandem dimer matures efficiently at 37 degrees Celsius and effectively behaves as a monomer in fusion products, although at twice the molecular size and weight.
By introducing a combination of both single point mutations into the wild-type EosFP tetramer, a functional monomeric protein has been created that is referred to as mEosFP. Similar to the dimer subunits, the monomer is able to be incorporated into functional biological chimeras to serve as a marker in live-cell imaging, although the monomer fusions are only functionally expressed at temperatures below 30 degrees Celsius (limiting their applications in mammalian systems). Fluorescence spectroscopy of the highlighter protein indicates a pH dependence on photoconversion, suggesting that the protonated form of the chromophore is necessary for activation, which is consistent with an excited-state proton transfer mechanism. Cleavage of the Eos peptide backbone during the green-to-red photoconversion has also been observed for the Kaede and KikGR fluorescent proteins (as discussed above; see Figure 6), which feature similar highlighter characteristics. In fact, the Eos, Dendra, and Kaede chromophores may ultimately prove to be either identical or isomeric in structure, but the histidine (His62) residue in the KikGR chromophore unexpectedly adapts a cis configuration rather than the trans arrangement illustrated in Figure 6 for the photoconverted red species.
The unique green-to-red optical highlighters discovered thus far in reef coral proteins certainly warrant an aggressive effort focused on solving the problems associated with aggregation, as well as fine-tuning photoactivation requirements and imaging spectral profiles. By engineering a variant that matures rapidly at 37 degrees, the monomeric Eos protein, which features optical properties very similar to Kaede, should be far more useful as an epitope tag due to the dramatically reduced tendency to form intermolecular associations between fusion proteins in vivo. In the future, by engineering optical highlighter proteins that shift photoconversion illumination wavelengths to the blue and green spectral regions, which are significantly less toxic to living cells, coupled with shifts of fluorescence emission to the yellow through far-red wavelength bands, the potential applications for Kaede and Eos derivative probes can be greatly expanded.
Kindling Fluorescent Proteins (KFPs)
A useful non-Aequorea optical highlighter, the Kindling fluorescent protein (KFP1) has been developed from a non-fluorescent chromoprotein isolated in Anemonia sulcata, and is now commercially available. Kindling fluorescent protein does not exhibit emission until illuminated with green or yellow light in the region between 525 and 580 nanometers. Low-intensity light results in transient red fluorescence (kindling) with excitation and emission maxima at 580 and 600 nanometers, respectively, which slowly decays upon cessation of illumination as the protein relaxes back to its initial non-fluorescent state (exhibiting a half-life of approximately 50 to 60 seconds). Irradiation with intense blue light quenches the kindled fluorescence immediately and completely, allowing tight control over fluorescent labeling. Note that both kindling with low intensity green light and quenching of fluorescence by blue light are reversible processes for the wild-type protein. In contrast, high intensity illumination or continued irradiation at moderate levels results in irreversible kindling with a fluorescence intensity approximately 30-fold greater than that of the non-activated protein (see column 3 of Figure 1). Irreversibly kindled molecules do not lose their fluorescence and are not quenched by illumination with blue light. This feature allows for stable long-term highlighting of cells, tissues, and organelles similar to PA-GFP and other highlighter proteins.
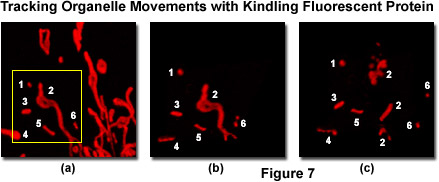
Presented in Figure 7 is a series of images tracking mitochondria from eukaryotic cells grown in culture using the kindling fluorescent protein (KFP1). Opossum kidney cortex proximal tubule epithelial cells (OK line) were transfected with a plasmid vector containing KFP1 fused to a mitochondrial targeting sequence and transferred to a live-cell imaging chamber. A typical field (Figure 7(a)) was illuminated with a helium-neon laser at 543 nanometers using 3-percent power output to establish the distribution pattern of labeled mitochondria within a single cell. This laser power level induces reversible kindling in all of the labeled mitochondria enabling visualization of size and location. Next, a region of interest was outlined (yellow box; Figure 7(a)) and irradiated with 40-percent laser power output to irreversibly kindle the mitochondria in the selection area, followed by illumination with the 457-nanometer spectral line of an argon-ion laser at 2-percent power to quench reversibly kindled mitochondria within the visualized field. The irreversibly kindled mitochondria were tracked for a period of 15 minutes using 1-percent power from the helium-neon laser. Figures 7(b) and 7(c) illustrate the KFP1-labeled mitochondria at 5 minutes (Figure 7(b) and 15 minutes (Figure 7(c)) to demonstrate tracking of the organelles as they traverse the microtubule network. Note the fragmentation of mitochondria that occurs over the longer time scale.
Additional site-directed mutagenesis efforts of the native sea anemone chromoprotein (asCP) and several variants have created a new series of kindling fluorescent proteins that can be reversibly photoconverted between activated (fluorescent) and inactivated (non-fluorescent) states. The anemone kindling proteins exhibit fluorescence in the orange-red region of the visible spectrum with absorption profiles having maxima around 580 nanometers and emission peaks ranging from 600 to 630 nanometers. The optical contrast enhancement between the dark and kindled states approaches 70-fold for the brightest of these variants. However, the short half-life exhibited by the kindled state prevents the use of these probes as an activated fluorescent label for long-term in vivo tracking studies targeted at understanding sub-cellular dynamics. Regardless, the ability to precisely control fluorescence emission intensity is particular useful when tracking particle movement in a crowded environment. For example, kindling fluorescent protein has been successfully used to track the fate of neural plate cells in developing Xenopus embryos and the motions of individual mitochondria in PC12 cells. Current research efforts are directed towards developing more advanced kindling fluorescent proteins that can be activated for longer periods of time.
Investigations into the mechanism of fluorescence activation in kindling fluorescent proteins using site-directed mutagenesis have revealed that the amino acids spatially surrounding the tyrosine residue at position 64 in the chromophore are critical to the photoconversion reaction. Changes in the chromophore charge distribution, molecular conformation, or environmental variables are the most plausible explanations for these results. Neutral and anionic species of most green fluorescent protein variants have significantly different excitation spectra, but the excitation maximum of the kindling proteins are very close to the absorption maximum before photoconversion. This observation lends credibility to a hypothesis that another phenomenon is responsible for the kindling effect. On the basis of structural modeling, x-ray diffraction analysis, and mutagenesis results, a mechanism involving photon-induced isomerization of the chromophore tyrosine residue has been proposed as the underlying driving force behind conversion of the protein into a fluorescent state. Support for this theory derives from the ability to transform non-kindling and non-fluorescent chromophores into kindling fluorescent proteins through the appropriate amino acid substitutions.
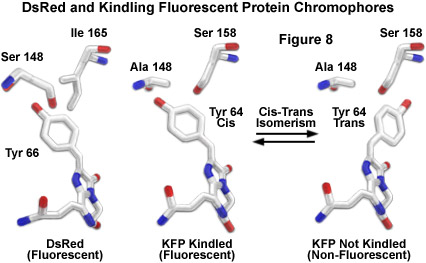
Schematic molecular models of DsRed and both the kindled and non-kindled forms of KFP1 are illustrated in Figure 8 to demonstrate analogies between the chromophores. The carbon atoms are represented as white sticks, while the oxygen and nitrogen atoms are colored red and blue, respectively. Neighboring residues of the DsRed tyrosine at position 66 (equivalent to Tyr64 in KFP1) are isoleucine 165 and serine 148. The proposed model for generation of fluorescence in kindling proteins involves a cis-trans isomerization (Figure 8) of the excited chromophore to a fluorescent state. The critical serine residue at position 158 in the kindling chromophore (an isoleucine in DsRed; Figure 8) has been suggested to stabilize the tyrosine 66 residue in the trans configuration (a non-fluorescent state). Excitation of the kindling chromophore enables the tyrosine 64 residue to isomerize into the cis position, which produces fluorescence. This hypothesis has been supported by the construction of a mutant in which the serine at position 158 is substituted for valine. The mutant loses all kindling properties and is naturally fluorescent, lending evidence to the theory that the chromo (non-fluorescent) state is blocked by the valine methyl groups, which sterically prohibit conversion to the trans isomer.
The major drawback of all the anemone kindling proteins examined to date is their tendency to aggregate into tetramers, which seriously affects the potential for use as protein labels without some degree of disturbance to normal biological processes. However, the kindling proteins are excellent candidates for bulk photolabeling and tracking of individual organelles and cells within a large population. Additional advantages of the kindling proteins include their red and far-red fluorescence emission spectral profiles, which facilitates their utility in multi-color labeling experiments with cyan and green fluorescent proteins. Furthermore, the reversibility of the kindling process allows investigators to examine the entire fluorescent pattern of labeled cells prior to irreversible photolabeling of specific regions. As an added benefit, dehydrated kindling proteins preserve the ability to be reversibly photoconverted, and therefore may provide useful service in the production of photoluminescent films, photochemical memory cells, and a variety of other nanotechnology applications.
Dronpa: A Read-Erase-Write Optical Light Switch
A new generation of specialized optical highlighters with reversible on-off switching capabilities was heralded by the introduction of Dronpa, a monomeric fluorescent protein derived from Pectiniidae, a family of stony reef corals featuring several members that naturally emit faint fluorescence upon irradiation with ultraviolet light. Named after a fusion of the ninja term for vanishing (dron) and photoactivation (pa), Dronpa exhibits unusual photochromic behavior due to its ability to toggle fluorescence on and off by illumination with two different excitation wavelengths. Dronpa was engineered using both directed and random mutagenesis to generate a monomeric version of the wild-type oligomeric fluorescent protein having a major absorption maximum at 503 nanometers and a minor peak at 390 nanometers at neutral pH. The absorption peak at 503 nanometers is due to the deprotonated species of the protein, while the smaller peak at 390 nanometers arises from the protonated form. When irradiated at 488 nanometers, the fluorescence emission spectral profile of the deprotonated species has a maximum at 518 nanometers with a relatively high quantum yield of 0.85. In contrast, the protonated from of the protein is almost non-fluorescent. Photoswitching of Dronpa occurs by interconversion between the deprotonated and protonated forms of the optical highlighter. Upon intense irradiation at 488 nanometers, the protein population is very efficiently driven to the protonated species with a commitment decrease in fluorescence to produce a dim (off) state in which the 390-nanometer absorption peak predominates. The dim state is readily converted back to the original fluorescent (on) deprotonated state with minimal illumination at 405 nanometers.
Aside from the fact that Dronpa fluorescence emission intensity dramatically exceeds that of enhanced green fluorescent protein (EGFP; see Table 1), the most striking feature of this optical highlighter is the rapid rate of photoswitching after excitation at 488 nanometers (producing green emission), which can be readily restored in full by subsequent irradiation at 405 nanometers (as discussed above; see column 4 of Figure 1). Note that photoactivation of Dronpa requires much less photon energy than does photoswitching to the non-fluorescent state (the quantum yield ratio of the two processes exceeds 1000). This pattern of deactivation followed by reactivation can be continuously repeated and is not pH sensitive, indicating a potentially truly unique ability to reversibly photoswitch fluorescence emission in chimeric fusion products. The major drawback is the relatively fast photoswitching rate to the non-fluorescent protonated species of Dronpa when illuminated at 488 nanometers, limiting the number of images that can be collected after photoactivation. However, the judicious application of neutral density filters or carefully controlled laser attenuation (with acousto-optic tunable filters; AOTFs) should enable the ability to capture multiple images of Dronpa-tagged proteins in the activated state.
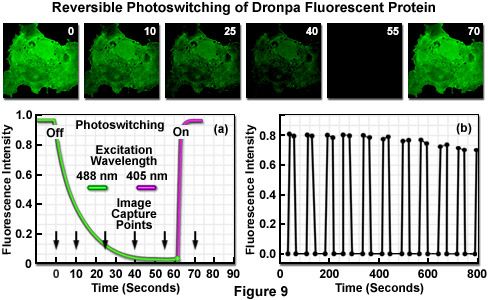
The reversible photoswitching of Dronpa fluorescence is illustrated in Figure 9 using an isolated transformed African green monkey kidney cell (COS-7 line) grown in culture. The adherent culture was transfected with a vector containing only the Dronpa protein gene (without a sub-cellular fusion target) and grown in a live-cell imaging chamber. The initially very bright green fluorescence observed upon excitation at 488 nanometers (Figure 9; image time point = 0 seconds) slowly fades over a period of 50 to 60 seconds (Figure 9(a) and time points 10 through 55 seconds) to an undetectable level at moderate illumination intensity. The decay curve (green) is illustrated in Figure 9(a) as the highlighter converts from the deprotonated to the protonated species. Upon photoactivation using a 405-nanometer diode laser (violet curve in Figure 9(a)), Dronpa fluorescence is fully restored. The sequence of fading followed by restoration of fluorescence through photoactivation was repeated for more than 10 cycles (Figure 9(b)) to reveal that the initial fluorescence intensity of fully recovered Dronpa slowly decreases with continued rounds. After 10 cycles, the recovered fluorescence intensity of Dronpa in this specimen was reduced to 88 percent of the initial value, but the photoswitching cycle can be rapidly repeated (on a millisecond time scale) with isolated single protein molecules for over 100 rounds.
Although photochromism (the ability to switch fluorescence on and off) has been observed in the wild-type and several yellow fluorescent protein variants of Aequorea victoria GFP at the single molecule level, none have demonstrated this phenomenon when measured in bulk. In these studies, during several minutes of illumination at 488 nanometers, the molecules produced fluorescence for several seconds, followed by an equally short time interval without emission, followed again by resumption of emission. Termed blinking behavior, this on-and-off switching sequence can be repeated a number of times before each green fluorescent protein molecule ultimately reaches a final long-lived non-fluorescent state upon the emission of approximately one million photons. The bright state can be recovered by irradiation with violet light (405 nanometers) for a period of five minutes before re-initiating the sequence by illuminating with a 488-nanometer laser. In this manner, many native green fluorescent protein derivatives display an optically induced switching effect in which each molecule is individually addressable. However, the ability of large Dronpa-tagged molecular ensembles (including organelles and entire cells) to collectively act as an information storage medium with the ability to write, erase, and read information nondestructively, and with high efficiency, is truly unique in the field of fluorescent proteins.
Practical Considerations for Experimental Design
When designing experiments using optical highlighter fluorescent proteins, several important aspects should be considered with regards to live-cell imaging, microscope configuration, vector construction, and the choice of proteins in order to optimize image acquisition parameters. These unique probes are primarily used to monitor dynamic processes in living cells, which often requires maintaining the cell culture in a healthy condition on the microscope stage for extended periods of time. A variety of specialized heated imaging chambers fabricated as stage inserts are commercially available for long-term cell maintenance on the microscope, but the investigator must also consider several essential auxiliary requirements, such as a carbon dioxide source, light-tight microscope enclosures, and vibration isolation. In short, the experimental conditions necessary to successfully image living cells for lengthy periods should be carefully established before embarking on experiments with optical highlighter proteins.
Several of the optical highlighter fluorescent proteins described above can be successfully imaged using traditional widefield fluorescence microscopy techniques, but serious quantitative investigations involving photobleaching methodology and photoactivation often must be performed on a confocal or multiphoton microscope equipped with specialized laser systems. Specifically, PA-GFP, PS-CFP, Kaede, EosFP, and Dronpa all require near-ultraviolet or violet illumination for photoactivation or photoconversion, but longer wavelength sources (blue and green excitation) are necessary for imaging the proteins. Therefore, confocal microscopes should be equipped with an ultraviolet or violet laser, as well as visible light lasers emitting blue and green spectral lines. The most popular current laser configuration for optical highlighters is a 405-nanometer diode, 488-nanometer argon-ion, and a 543-nanometer helium-neon, although ultraviolet high-energy argon, diode-pumped solid-state, and helium-cadmium lasers may serve as well for photoactivation (keeping in mind the potential cell damage artifacts possible with ultraviolet irradiation). Other useful imaging lasers include several new diode and helium-neon models and the multi-spectral krypton-argon systems. Multiphoton instruments should ideally be configured with a broadband Ti:Sapphire laser featuring tunable output in the wavelength range between 750 and 1100 nanometers.
The delineation of specific regions for illumination during photoconversion and photoactivation is most efficiently conducted with an acousto-optic tunable filter (AOTF), which can be conveniently used to define circular, elliptical, rectangular or free-hand selections for irradiation of the specimen. The AOTF also serves to fine-tune laser power levels to modulate intensity at the specimen, and is capable of sequentially scanning specimens using a technique known as high-speed channel switching or multitracking. This approach enables the sequential excitation and collection of emission from several fluorescent probes to avoid bleed-through artifacts and more accurately separate emission spectra. Defining regions of interest in widefield microscopy presents a greater challenge. Research-level microscopes are often equipped with a variable aperture that can be adjusted to illuminate selected regions in the specimen, although with much less accuracy than a confocal microscope AOTF system. Widefield instruments must also be configured with specialized fluorescence filter combinations in order to image several of the optical highlighter proteins. Comparatively, the confocal and multiphoton instruments are far more suitable for quantitative analysis of cellular dynamics using photoconversion and photoactivation techniques than are widefield microscopes and should therefore be the first choice for these applications.
The selection of optical highlighter probes should be determined by the specific experimental requirements of the host cell system and the biological target involved in the investigation, which can include membranes, organelles, nucleic acids, and proteins. In general, for sub-cellular localization experiments using fusion vectors, monomeric fluorescent proteins are vastly superior to those that form higher order aggregates (primarily dimers and tetramers) during in vivo expression. For example, Kaede is an obligate tetramer that may not perform as expected when fused to the protein of interest for photoconversion experiments. Choosing instead the monomeric version of EosFP or the PS-CFP highlighter ensures a greater probability of success. Several of the optical highlighters discussed in this article are commercially available and contain multiple cloning sites in the host plasmid, which are designed to enable the incorporation of complementary DNA sequences containing a wide spectrum of restriction endonuclease cleavage sites. These vectors are ideal for cloning specific sub-cellular localization target genes to produce fusion proteins.
Generation of sufficiently high fluorescence signal levels for optimal image acquisition is also an important factor to consider when using optical highlighters. In this regard, the absorption molar extinction coefficient and fluorescence quantum yield values for the native and photoconverted protein species can be employed as a gauge to determine relative brightness levels. For example, both Kaede and mEosFP have similar spectral bandwidth profiles in the green (native) and red (photoconverted) regions of the visible light spectrum. However, the native green form of Kaede has approximately twice the fluorescence emission intensity or brightness level of green mEosFP due to a higher extinction coefficient and quantum yield. Therefore, before photoconversion, the imaging signal-to-noise ratio for Kaede is much higher than that of mEosFP. After photoconversion, both proteins feature similar brightness levels (see Table 1) and produce comparable images. Among the optical highlighter proteins currently available, Dronpa, Kaede, and mEosFP are the brightest, followed by PA-GFP, which is similar in brightness level to the photoconverted species of Kaede, but significantly lower than the native protein. The commercially available PS-CFP2 variant is about one-half as bright as Kaede, whereas the kindling and PS-CFP proteins, both in the native and photoconverted forms, are by far the dimmest optical highlighters, yielding only about 25-percent of the brightness level exhibited by photoconverted Kaede (Table 1). The latter highlighters exhibit significantly lower signal-to-noise ratios during imaging, a factor that should be considered when planning investigations of biological targets having low abundance levels or requiring high imaging speeds.
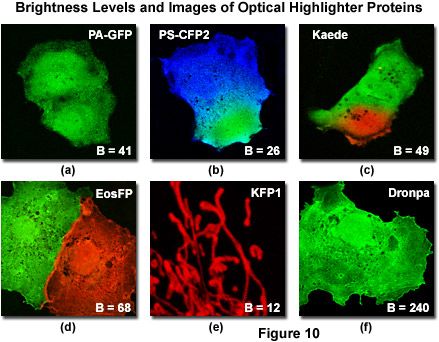
Illustrated in Figure 10 is a series of digital images captured under optimal conditions for several of the more useful optical highlighters discussed in this review. Also presented in the figure are the brightness levels for each protein (after photoactivation or photoconversion) listed as a percentage of EGFP fluorescence intensity. The level of brightness is determined by the product of the molar extinction coefficient (at maximum absorption) and the fluorescence quantum yield. Note that the brightness values listed in Figure 10 and Table 1 will vary substantially when the fluorescent proteins are excited off-peak by fixed laser spectral lines or when using a wider bandwidth produced by arc-discharge lamps coupled to bandpass excitation filters. Furthermore, fluorescent protein brightness levels can fluctuate substantially from cell to cell, especially in transient transfections where the varying number of plasmid vectors absorbed per cell results in vastly different levels of expression. With the exception of kindling fluorescent protein (KFP1; Figure 10(e)), which is localized to the mitochondria, the optical highlighter fluorescent proteins illustrated in Figure 10 were not coupled to fusion partners and tend to diffuse throughout the cytoplasm and nucleus. Two of the highlighter protein images (Figure 10(b) and 10(c)) were captured very shortly after photoconversion of a selected region with a high-intensity violet laser, before the photoconverted species was able to diffuse throughout the cytoplasm.
Conclusions
The complex interplay of biological roles for an ever-increasing number of fluorescent proteins derived from a wide variety of marine species is only beginning to be understood. Light-induced changes to the autocatalytic chromophores, including photoactivation and photoconversion, may serve as a highly evolved photoprotection mechanism to assist these organisms in the useful dissipation of high-energy sunlight, especially the damaging shorter wavelengths, via the absorption and subsequent fluorescence re-emission of longer and safer wavelengths. In many cases, these remarkable fluorescent proteins display very high photostability and dynamic photo-induced transformation properties, including spectral fine-tuning of donor-acceptor pairs (and even cascades) for resonance energy transfer. The large number of spectral variants already discovered, featuring emission profiles covering the entire visible spectrum, suggests that the diverse optical and biochemical properties of these proteins will generate a host of new candidates as probes for biological investigations and ensure the continued development of unique genetically engineered fluorescent proteins.
The ability to selectively initiate or alter fluorescence emission profiles in photoconversion optical highlighter proteins renders these probes as excellent tools for exploring protein behavior in living cells. As the fluorescence intensity (or color spectrum) of highlighters occurs only after photon-mediated conversion, newly synthesized non-photoactivated protein pools remain unobserved and do not complicate experimental results. This signal independence from new protein synthesis could potentially enable the study of protein degradation kinetics in tagged molecules by techniques such as optical pulse labeling and monitoring of the fluorescence over time. Additional quantitative techniques, including fluorescence correlation spectroscopy (FCS), should prove useful to measure the mobility of photoactivated optical highlighters in small numbers, even down to the single molecule level.
Photoactivation and photoconversion of optical highlighters is generally rapid and produces stable fluorescence signals. Therefore, these probes can be used to examine a variety of kinetic properties of tagged proteins, such as their diffusion coefficients, fractional mobility, compartmental residency time, and exchange rates. In many cases, photoconversion offers greater flexibility than the traditional photobleaching techniques of FRAP and FLIP. In addition, cell lineage or translocation in developing organisms can be easily monitored by imaging the fluorescence dispersion after photoactivation of a single cell or subpopulation of cells. In these regards, optical highlighters demonstrate remarkable promise to complement and extend the range of present fluorescent protein imaging applications.
The obligate tetrameric nature of many reef coral fluorescent protein optical highlighters often severely limits their application as protein fusion labels for in vivo investigations of biological structure and function. Once expressed, the formation of tetramers can produce abnormal localization, disrupt normal function, or restrict the fusion product to aggregation within a specific organelle or the cytoplasm. This effect is particularly marked when the fluorescent protein is fused to a partner such as actin, tubulin, or caveolin, which themselves participate in natural oligomer formation. The basic strategy for creating fluorescent protein monomers involves repeated site-directed mutagenesis to disrupt tetramer interfaces, usually by substitution of hydrophilic or charged amino acids for hydrophobic and neutral moieties. Because a significant decrease in fluorescence emission quantum yield usually accompanies the genetic modifications, a round of random mutagenesis is often necessary to rescue fluorescence.
As the development of optical highlighters continues, fluorescent proteins useful for optical marking should evolve towards brighter, monomeric derivatives with high contrast that can be easily photoconverted and display a wide spectrum of emission colors. For example, proteins capable of reversible photoactivation, red-to-green photoconversion, improved expression at elevated temperatures, and derivatives emitting in the far red or near-infrared regions of the spectrum would be especially useful. Coupled with these advances, microscopes equipped to smoothly transition between illumination modes for fluorescence observation and regional marking will become commonplace in most cell biology laboratories. The combination of photoactivation and photoconversion with advanced fluorescence techniques, such as resonance energy transfer and multiphoton excitation, will enable the study of protein dynamics with greater precision and spatial resolution. Ultimately, these innovations have the potential to make significant achievements in the spatial and temporal dynamics of signal transduction systems.