3D Spatial Analysis of High-Throughput Drug Screening
High-speed 3D images of cancer spheroids were analyzed using NoviSight™ software to accurately evaluate drug efficacy for multiple samples.
Introduction
Assessing a drug’s performance using three-dimensional cancer spheroids is important because the spheroids reflect the complicated tumor microenvironment. This enables researchers to evaluate a drug’s effectiveness under parameters that more closely resemble a tumor’s natural environment. To perform high-throughput drug screening using spheroids, researchers must use a simple protocol, semi-automated high-speed imaging, and multi-well 3D analysis.
In this study, we performed a homogeneous cell viability assay using a 384-well plate without liquid exchange, took high-speed images using the FV3000RS confocal microscope’s resonant scanner, and analyzed the images with NoviSight 3D software. Spheroids were analyzed in 3D to more accurately evaluate drug efficacy for multiple samples.
Application workflow


Benefits
- Use a simple protocol with no liquid exchange needed
- Automatically capture images using a high-speed resonant scanner
- Accurately analyze multiple samples with 3D spatial analysis
Methods
Cell preparation
HeLa cervical cancer cells were seeded in a Corning® 384-well round-bottom plate (100 cells per well) and cultured for 24 hours in Dulbecco’s Modified Eagle Medium (DMEM) with 10% fetal bovine serum (FBS). The plate was gently centrifuged to remove air bubbles.
Sample preparation
We added the drugs cisplatin and staurosporine (STS) to the samples at various concentrations and incubated them for 24 hours. Using the difference in membrane permeability, we determined cell viability by counting total vs. dead cells with ReadyProbes™ Cell Viability Imaging Kit from Thermo Fisher Scientific® (total cells: blue/ dead cells: green). The samples were then stained and incubated for five hours. This simple preparation method does not require any liquid exchange, fixation, or washing from cell seeding to imaging.
Imaging and analysis
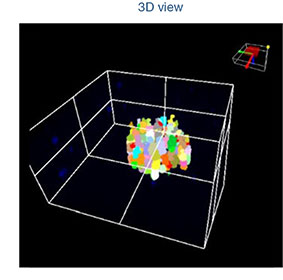
We obtained fluorescence images of spheroids using the FV3000RS confocal laser scanning microscope with a LUCPFLN20X semi-apochromat objective lens. After we set the imaging area, the microscope’s resonant scanner automatically captured the images. NoviSight™ software can import data from multiple images paired with information about the plate, such as the position of the well and the sample location. Once imported, the software reconstructs the images in 3D. NoviSight software can recognize objects, such as nuclei, then analyze the various signals in the objects.

Fig. 1 Method for high-throughput drug screening without liquid exchange
Results
High-speed 3D imaging of multiple samples
It took about one minute to observe a Z stack image of a single well (2.33 μm thick, 122 slices, 2 channels). The cisplatin and STS treatment increased the number of dead cells in a dose-dependent manner (Fig. 2*).
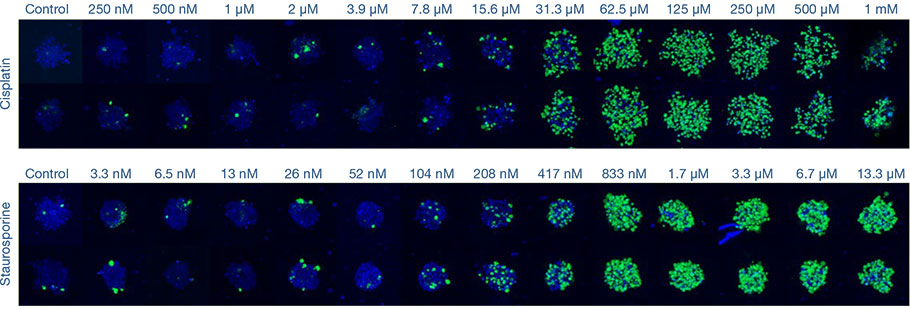
Fig. 2 High-speed imaging of drug response with spheroids*
High-throughput 3D analysis of drug sensitivity in spheroids
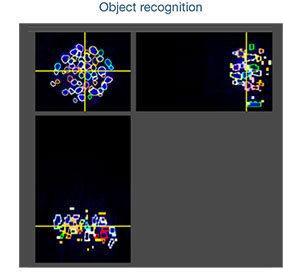
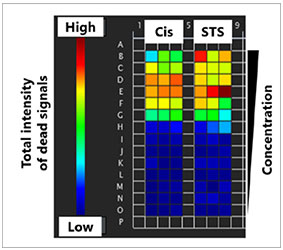
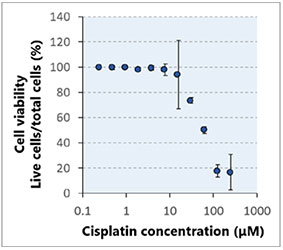
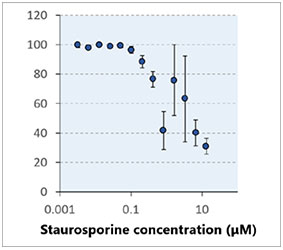
The total cell signals (blue) enabled us to recognize the nuclei (Fig. 3A*). All cells were then classified into either live or dead cells based on the presence or absence of green signals (positive signals: dead cells/ negative signals: live cells). The positive and negative signals were classified by confirming the image selected from the graph (Fig. 3B*). After classification, you can easily confirm the total intensities of dead signals in spheroids using a heat map in the software (Fig. 4A). The percentage of live to total cells was then calculated and plotted (Fig. 4B). The results showed that both drugs were highly sensitive to HeLa cells.
(A)
|
|
|
(B)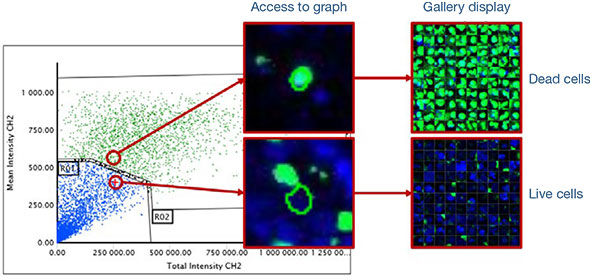
Fig. 3 NoviSight™ software can recognize and classify objects based on signals*
(A)
| (B)
|
|
Fig. 4 Heat map dispaly and dose response curve
High-throughput spatial analysis of drug sensitivity
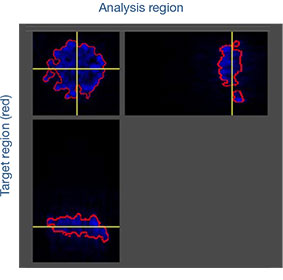
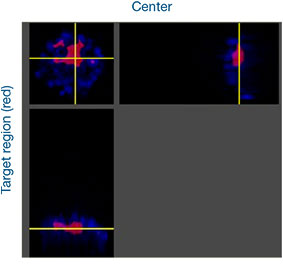
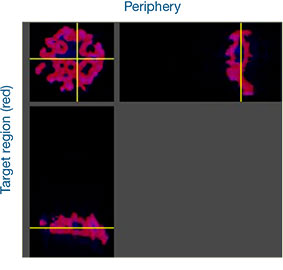
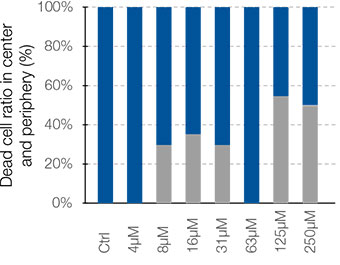
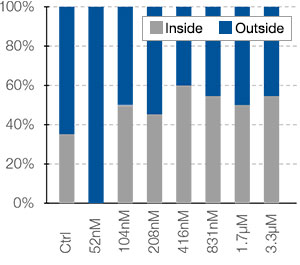
The images in this study were captured three dimensionally to perform advanced spatial analysis. Using NoviSight™ software, you can set the target region for analysis. We set the software to analyze each spheroid’s center and periphery (Fig. 5A). Then we performed population analysis within these areas. This method enables spatial analysis of drug efficacy for a large number of spheroids on a multi-well plate. The software then calculated the ratio of each dead cell to the number of cells in the central and periphery areas (Fig. 5B).
In this case, the number of dead cells in both the center and periphery increased in a dose-dependent manner. Compared to cisplatin, staurosporine is effective in the central part of the spheroid, even at low concentrations.
(A) |
|
|
(B) |
|
|
Fig 5. NoviSight software can perform advanced spatial analysis of spheroid regions
Conclusion
Using a simple protocol, high-speed confocal imaging, and NoviSight software, we acquired high-throughput, 3D images to classify cell viability in the spheroids and analyze drug responsiveness. This spatial analysis technique enables more advanced drug evaluation for multiple samples.
Author
Hiroya Ishihara, Biological Evaluation Technology 2, Research and Development
*Although it became one of the most important cell lines in medical research, it’s imperative that we recognize Henrietta Lacks’ contribution to science happened without her consent. This injustice, while leading to key discoveries in immunology, infectious disease, and cancer, also raised important conversations about privacy, ethics, and consent in medicine.
To learn more about the life of Henrietta Lacks and her contribution to modern medicine, click here.
http://henriettalacksfoundation.org/
Products related to this application
was successfully added to your bookmarks
Maximum Compare Limit of 5 Items
Please adjust your selection to be no more than 5 items to compare at once
Not Available in Your Country
Sorry, this page is not
available in your country.
