Analysis Workflow for 3D Live/Dead Cell Assays
Summary
NoviSight 3D cell analysis software provides statistical data on spheroids and other 3D objects by measuring parameters like volume, sphericity, and cell numbers. This application note will introduce the NoviSight 3D cell analysis workflow for a live/dead spheroids assay.
Introduction
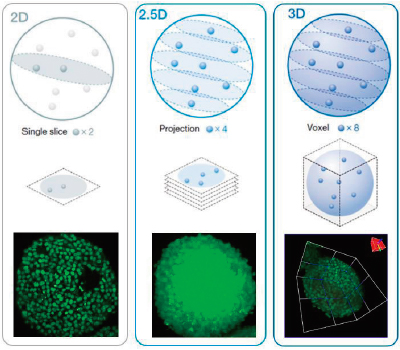
3D high-content analysis (HCA) using spheroids or organoids can be difficult. Ideally, we can analyze 3D samples three dimensionally to obtain information on their morphology and interior condition. NoviSight software’s true 3D analysis can simplify this process by measuring volume, the number of cells, and the cell condition of 3D samples based on sequential Z-stack fluorescent images. On the other hand, conventional analysis uses a single image slice (Figure 1, left, 2D analysis) or uses a projection image (Figure 1, center, 2.5D analysis). Both techniques lose a lot of data from the 3D sample, such as spatial, morphological, and volumetric information (Figure 1). In this application note, we demonstrate how to quantitatively analyze 3D samples with NoviSight software using a live/dead spheroids assay. |
Figure 1 (left to right): 2D, 2.5D, and 3D analysis schematic. |
Methods
Sample preparation
We cultured 500 HT-29 cells/well in a PrimeSurface® 96U plate (Sumitomo Bakelite) for eight days to form spheroids, then applied various concentrations of staurosporin (STS) with NucView® 550 (Biotium) the next day. NucView 550 is a caspase-3 fluorescent probe, and the dead cell nuclei were fluorescently stained with red. After treatment with STS and NucView 550, the HT-29 spheroids were fixed with 4% paraformaldehyde and permeabilized with 0.5% Triton X-100/PBS(-). The spheroids’ nuclei were stained with Hoechst 33342 at 4 °C (39.2 °F) overnight. After staining, the spheroids were cleared with SCALEVIEW-S4.
Imaging and analysis
We imaged the samples in three dimensions using the FV3000 confocal microscope and a semi-apochromat bjective lens (LUCPLFLN20X). You can see the acquisition conditions below. The Z-step size was 2 μm. A 405 nm laser was used for Hoechst 33342 (blue fluorescence), and a 561 nm laser was used for NucView 550 (magenta fluorescence). Figure 2 shows non-treated and STS-treated spheroids’ volumetric images acquired using the microscope. The core of a non-treated, 8-day cultured spheroid was dead likely due to low nutrition or hypoxia. Overall, STS induced the cell death of the HT-29 spheroids.
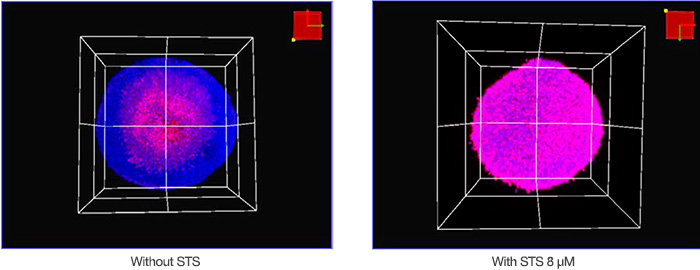
Figure 2: Volumetric view of HT-29 spheroids with (right) and without (left) STS.
Benefits
- Easily perform a 3D live/dead viability test
- Intuitive user interface helps you transform Z-stack images into reproducible quantitative data
3D Live/Dead Analysis Strategy
The steps outlined in Table 1 are required to quantitatively analyze live/dead spheroids using NoviSight™ software. In order for NoviSight software to three dimensionally recognize the nuclei from the Z-plane images, set the step size of the Z-section at 3 μm—the largest measurement to detect a single nucleus.
| Step | Details |
| Sample preparation |
Cell culture and fluorescent staining
Option: fixation and clearing if you want to analyze cell number, you should stain the nucleus ↓ |
| Imaging |
Acquiring several Z stack images
ex. confocal microscopy, multiphoton microscopy ↓ |
| Analysis |
1. Recognize objects you are interested in
ex. nucleus, volume, organelle 2. Set analysis parameters 3. Graphical analysis by gating 4. Statistical analysis |
Table 1: 3D analysis workflow from sample preparation to analysis.
NoviSight Software Analysis Steps
Main object recognition
The live/dead cell assay was evaluated by the number of live/dead cells. NoviSight software can detect the number of cells from the nuclear stains. To recognize the cell nucleus, we used a specialized NoviSight module for nuclear detection: NuclearL. When you input the appropriate cell size, background intensity, and Z/XY ratio (Z-axis elongation of the nucleus), NoviSight software can automatically detect the spheroid’s nuclei in 3D space (Figure 3A).
Analysis parameter setting
For all the nuclei stained with Hoechst 33342, the ones with a high NucView 550 signal intensity were dead cells. As a result, NoviSight software can classify the live/dead cells by the CH2 (NucView 550) intensity levels on the recognized nucleus objects (Figure 3B). This means that NoviSight software can classify spheroid live/dead cells using just the nucleus recognition setting.
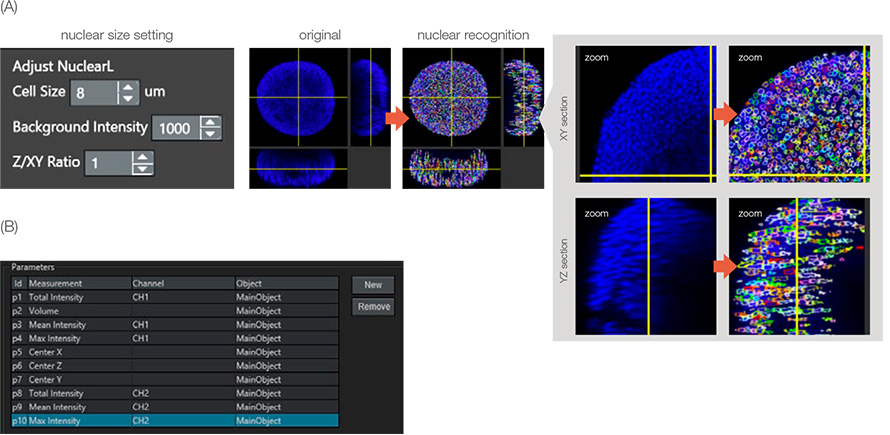
Figure 3: Recognition of parental objects. (A) Nuclei were recognized by the NuclearL module. Each recognized nucleus was enclosed by a colorful circle. (B) Analysis parameters were set. For example, parameter 10 is CH2 (dead signal) max intensity on the main object (nucleus).
Once the nucleus recognition finalizes, recognized nuclei can be plotted as object data in a scatterplot or histogram. The X or Y axis of the scatterplot can be adjusted from the analysis parameters. When you set them at the center X/Y respectively, the center X/Y of the main objects are plotted on the graph (Figure 4A). When you click on a point in the graph, NoviSight software can point to the same position in the original image (Figure 4B).
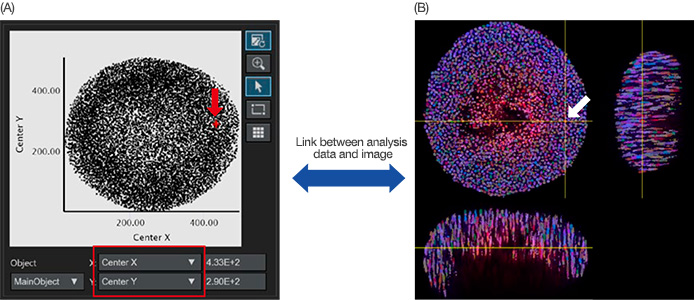
Figure 4: Quantitative analysis image of a spheroid. (A) When the center X and Y analysis parameters (set in Figure 3B) were set in the X and Y axis respectively, each recognized nucleus was plotted in the graph. The analysis parameters in the X/Y axis can be adjusted when necessary (red square). (A/B) NoviSight software can visually link the analysis data with the original images. When you click the recognized nuclear plot in the graph (A, red arrow), the same position automatically displays in the original image (white arrow).
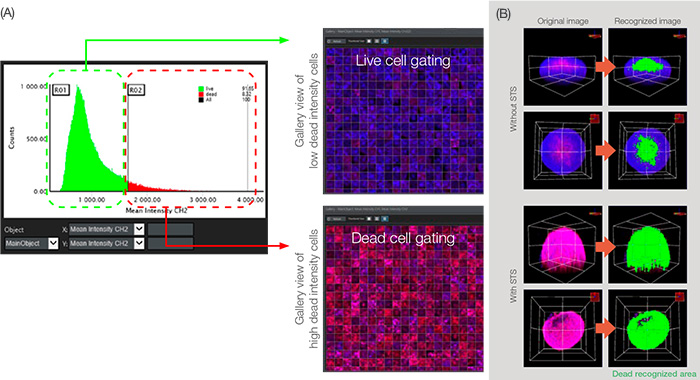
Figure 5: Graphical analysis for cell classification.
(A) When the analysis parameter mean intensity CH2 (set in Figure 3B) was set in the X and Y axis respectively, the graph shows main object counts (nucleus) in the order of CH2 (dead signal) mean intensity. Through CH2 intensity gating, we could divide live and dead cells. (B) Volumetric view of the dead recognized area displayed in green.
Statistical analysis
NoviSight software can analyze multiple samples simultaneously. The quantitative data from the analysis can be displayed as a heat map (Figure 6A) or exported as a CSV file for further analysis. The data can also be output in each gating. Here, the data shows that STS induced HT-29 cell apoptosis in a dose dependent manner when the various concentrations of STS were treated in HT-29 spheroids (Figure 6B).
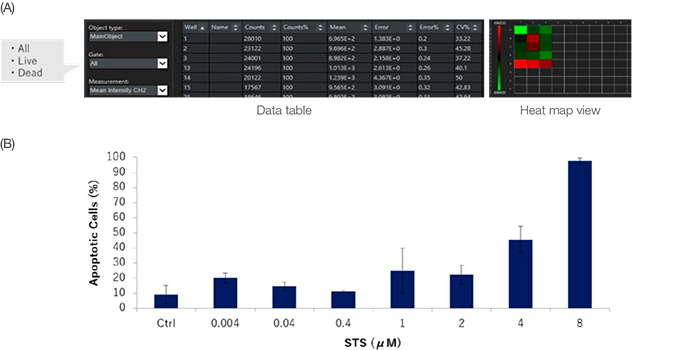
Figure 6: Quantification results of live/dead cell analysis for HT-29 spheroids with or without STS. (A) NoviSight software outputs quantification data for each gate.
The data can also be displayed in a heat map. (B) STS increased HT-29 cell death in a dose dependent manner.
Connecting data and images
The link between data and images is a key benefit of high-content analysis. Unlike a plate reader, HCA can reference the original image to visually confirm the morphology, position, and intensity of cells. NoviSight™ software takes full advantage of this capability. For example, the software can show the corresponding image when you click on a specific data point or object (Figure 7), such as:
- A point on a scatter plot
- An object image in gallery view
- A well on a heat map
- A number in a table
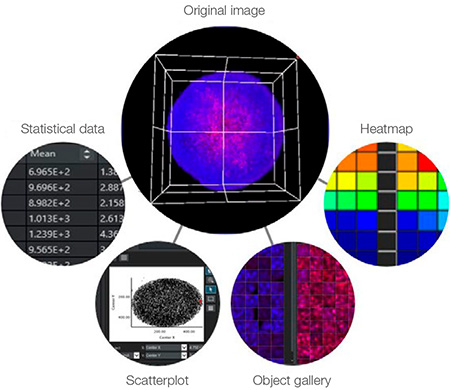
Figure 7: NoviSight software can display the same point on the corresponding image when you click on a data point or object.
Conclusion
3D quantitative analysis of 3D samples can seem complicated, but NoviSight software can streamline your workflow from start to finish. For instance, nuclear recognition is the only parameter needed for the live/dead analysis of spheroids. This streamlined workflow can also apply to relevant 3D models.
Author
Mayu Ogawa (Olympus)
Products related to this application
Sorry, this page is not
available in your country.