The Importance of Tissue Clearing and Objective Selection in 3D Analysis of Spheroids
Summary
Three-dimensional (3D) models like spheroids or organoids are thick and opaque due to light scattering, so it is difficult to image deep inside them while maintaining the entire morphology. However, tissue clearing techniques make it possible to image deep inside these samples by controlling different refractive indexes (RIs) among cellular compartments.
In this application note, we introduce a one-step spheroid clearing protocol using SCALEVIEW-S4 tissue clearing reagent, as well as describe the importance of RI matching between cleared spheroids and the objective lens.
Introduction
3D models, such as spheroids and organoids, are popular because they mimic the in vivo microenvironment more precisely than classic 2D monolayer models. However, it is difficult to image deep sections of thick 3D models because of light scattering caused by cellular compartments, such as lipids or pigmentations.
Today, many optical tissue clearing techniques (1, 2) can make spheroids or organoids transparent. These clearing techniques are typically divided into three types: solvent-based, aqueous-based, and hydrogel-embedding techniques. SCALEVIEW-S, an aqueous clearing reagent, rarely causes morphological changes in the cleared samples (3).
In this application note, we follow the SCALEVIEW-S4 spheroid clearing method. Since transparent 3D samples tend to have a high refractive index, we also describe the effect of RI mismatching by comparing images acquired using dry (RI: 1.0), water (RI: 1.33), and silicone (RI: 1.4) objectives.
Materials and Methods
Sample preparation
Human colorectal adenocarcinoma cells (line HT-29) were seeded in a 384-well U-bottomed microplate and cultured until the spheroid diameter was about 300 μm. The spheroids were fixed with 4% paraformaldehyde (PFA) solution at 4 °C (39.2 °F) overnight and stained with DAPI solution in PBS(-).
Clearing method
SCALEVIEW-S0, S1, S2, S3, S4, and the descaling solution were purchased (FUJIFILM Wako Chemicals) or manufactured (3). Table 1 shows the original protocol using these reagents.
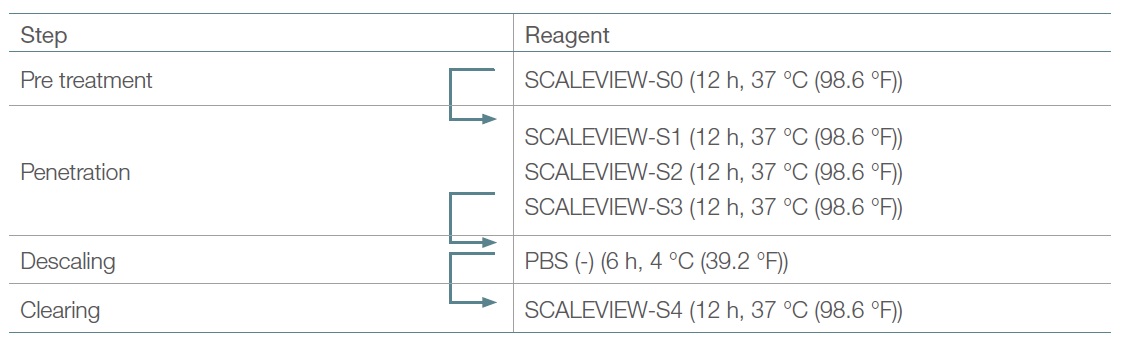
Table 1. Original SCALEVIEW-S protocol
Imaging method
We imaged the DAPI-stained HT-29 spheroids with and without clearing using our FLUOVIEW FV3000 confocal laser scanning microscope and the three different immersion objectives described above.
Results and Discussion
One-step spheroid clearing using SCALEVIEW-S4
The original SCALEVIEW-S protocol involves sequential liquid exchanges of six different reagents (S0–S4, descaling). The sample expands and contracts during treatment with reagents S0–S3 and the descaling solution, enabling S4 to clear the tissue and return the volume to almost 100% of its original size.
The original protocol is optimized for clearing whole mice brains, so it takes about 12 hours for each reagent to clear the sample. Since the approximately 200–300 μm thick spheroids or organoids are much smaller than a mouse brain, they can be cleared with incubation in reagent S4 for about one hour with gentle rotation after being fixed and stained.
Both the S4-cleared spheroid and the spheroid cleared using the original protocol kept its morphology, as shown in Fig. 1a below. You can see the fluorescent intensity of each cleared spheroid for each Z-position in Fig. 1b. The results quantitatively show that the spheroid can be cleared using the single reagent treatment of S4. This means that small 3D models like spheroids or organoids can be easily cleared with a one-step protocol using S4 after they are fixed and stained, helping to simplify 3D model imaging.
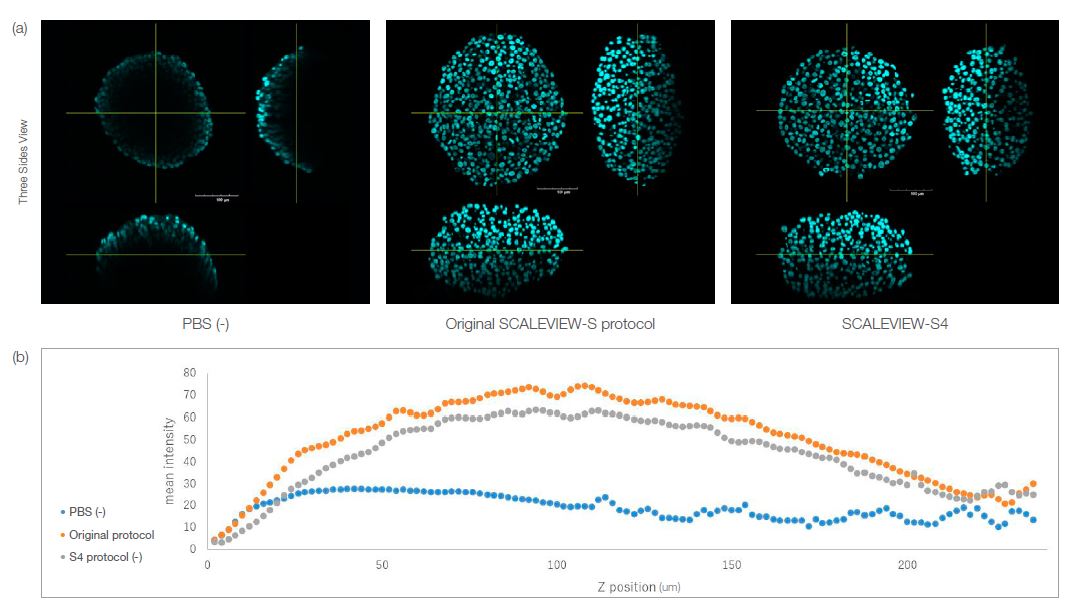
Fig. 1. HT-29 spheroids cleared using the SCALEVIEW-S and SCALEVIEW-S4 protocols. Both protocols can clear the spheroid.
The importance of RI matching between objectives and 3D samples
To get precise images of cleared 3D samples using confocal or multiphoton microscopy, you must consider the RI matching between objectives and 3D samples. Otherwise, RI mismatching affects image quality in the depth of the 3D sample. In this case, a large difference in RI between the objectives and 3D samples caused the object to distort in the Z-direction due to aberration.
Figure 2 below compares the image resolution of the S4-cleared HT-29 spheroids (RI: 1.47) captured with the three objectives: dry (RI: 1.00, UCPLFLN20X), water (RI: 1.33, UAPON20XW340), and silicone (RI:1.40, UPLSAPO30XSIR) immersion.
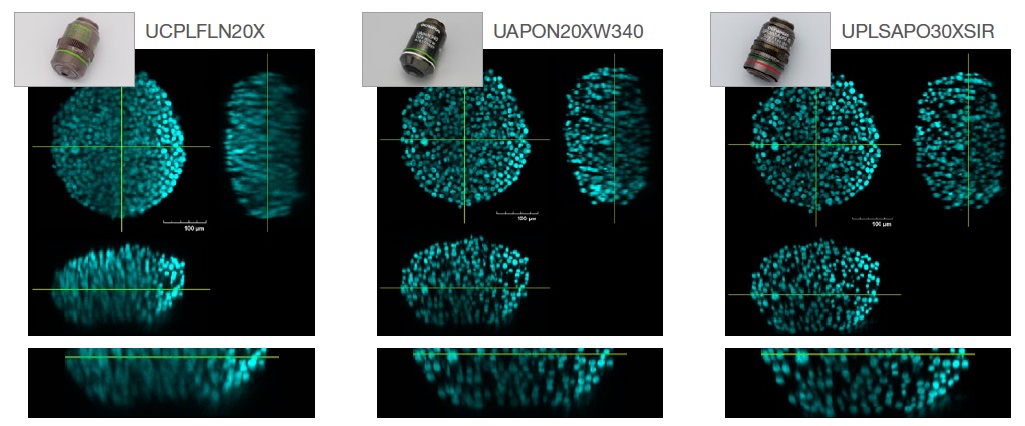
Fig. 2. The effect of objective selection on image resolution. Left: dry (RI: 1.00, UCPLFLN20X). Middle: water (RI: 1.33, UAPON20XW340).
Right: silicone (RI: 1.40, UPLSAPO30XSIR) immersion).
As shown in Fig. 2, selecting the optimal objective lens for RI matching helps us acquire clear images to more accurately understand the morphology of 3D samples.
The effects of spheroid clearing for 3D quantitative analysis
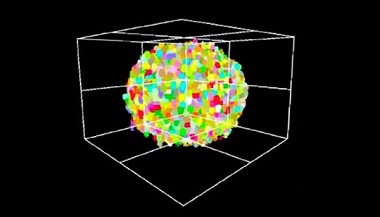
We can quantitatively analyze the 3D samples by clearing them and acquiring several Z-plane images using an appropriate objective. We used NoviSight™ 3D cell analysis software to perform 3D cell counting on the DAPI-stained HT-29 spheroids with and without clearing. We also compared cell counting accuracy among the 3D images acquired using different immersion objectives (Fig. 2). We checked the spheroid cell numbers by trypsinizing them and manually counting the number of cells.
NoviSight software’s cell counting analysis detected less than 20% of the total cells (vs. trypsinezed spheroids) in a non-cleared spheroid. In contrast, the software detected over the 90% of the total cells in a cleared spheroid (Fig. 3).
The dry objective image likely had a lower cell number than the trypsinezed spheroids because of misrecognition from a poor signal-to-noise ratio (see the red rectangle in Fig. 3). And while the software almost completely detected the nucleus in the water objective image, it lost the nucleus deep inside the spheroid (yellow rectangle in Fig. 3).
However, the software completely recognized the nucleus in the silicone objective image (green rectangle in Fig. 3).
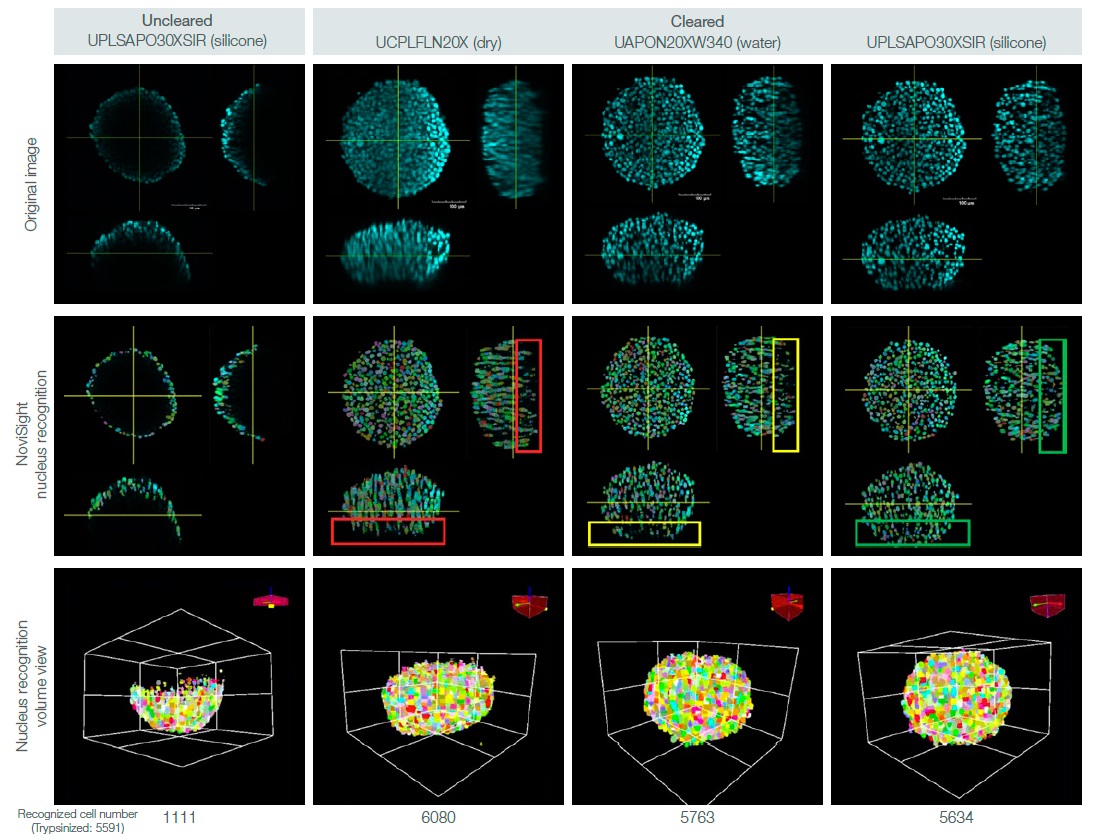
Fig. 3. Effects of spheroid clearing and objective selection on 3D cell counting.
Conclusion
Clearing techniques enabled us to count cells deep inside the sample so that we could achieve 3D quantitative analysis.
References
- Peng Wan et al., Evaluation of seven optical clearing methods in mouse brain, Neurophotonics (2018)
- Douglas S. Richardson et a., Clarifying Tissue Clearing, Cell (2015)
- Hama et al., ScaleS: an optical clearing palette for biological imaging, Nat Neurosci. (2015)
Author
Mayu Ogawa (Olympus)
Products Related to This Application
Sorry, this page is not
available in your country.