Since its inception, fluorescence imaging has become a staple tool of biological research. It has helped countless scientists visualize cellular structures and dynamic processes at the microscopic level.
If you have ever used a fluorescence microscope to image biological samples, you might have even noticed a faint, omnipresent background signal permeating the tissue. The signal can vary in intensity across different structures and will likely exhibit changes in intensity depending on the wavelength of your excitation source.
However, before you check protocols and notes for faulty staining techniques, consider the biological composition of your sample. Is it cellularized? Pigmented? Is there a signification amount of structural proteins present? If you answered “yes” to any of these questions, the signal you are seeing might not be as foreign as you think. Some, if not all of that background, emanates naturally as autofluorescence.
Biology Is Brighter Than You Think―Defining Autofluorescence
Autofluorescence, the natural emission of light by biological structures, is a widely occurring phenomenon in cells and tissues. It’s caused by endogenous molecular components exhibiting the ability to fluoresce. Much like the engineered fluorophores used in stains and dyes, autofluorescent molecules are typically comprised of polycyclic hydrocarbons with delocalized electrons that can be excited by incoming photons. Autofluorescent molecules show resistance to efficient vibrational relaxation after being stimulated by incoming light. As a result, the excess energy is emitted as a new photon that has a lower energy and higher wavelength than the exciting photon. While the mechanisms sound familiar, you may question why you haven’t encountered autofluorescence in your daily life. After all, you are a biological entity yourself. Yet, you do not readily fluoresce.
A few endogenous molecules, like chitin, are known to autofluoresce vibrantly under ultraviolet stimulation (see Figure 1, left). However, many autofluorophores are less likely to be excited by incoming photons compared to their engineered counterparts that scientists are more accustomed to seeing in the laboratory. The concentration of engineered contrast agents can likewise be adjusted in a benchtop staining protocol to restrict or boost a fluorescence signal, but natural autofluorescence is always limited to biological concentrations.
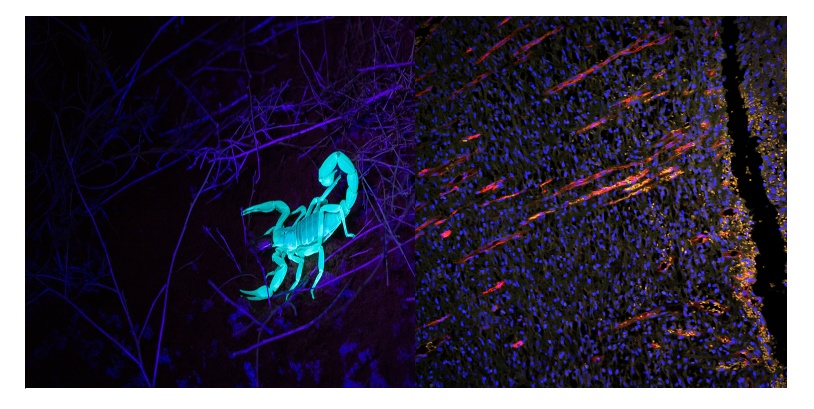
Figure 1. Examples of autofluorescence in living specimens. Left: a scorpion autofluoresces under ultraviolet (UV) stimulation. Right: image of rat skin recovery 10 days after trauma, showing neovasculature with vertical growth toward the wound cut in the epidermal layer. Blue (DAPI): nucleus. Orange (autofluorescence): skin tissue. Red (CD31): blood vessels. Image captured using the Olympus BX51 widefield fluorescence microscope and DP71 camera. Image courtesy of LiShuang Li, Experimental Research Center, China Academy of Chinese Medical Sciences.
Autofluorescent molecules also have distinct excitation windows, although most autofluorescence is excitable in the UV-green range and yields relatively broad excitation spectra. Combined, these factors make autofluorescence much more common to encounter when using imaging systems with dedicated fluorescence-stimulating light sources and photon detectors more sensitive than the naked eye (Figure 1, right: orange signal).
Common Sources of Autofluorescence in Life Science Research
To properly accommodate for the presence of autofluorescence in research imaging experiments, consider the biological components that comprise your sample. Here are some frequently observed autofluorescence producers that researchers encounter in the lab:
1. Nicotinamide adenine dinucleotide
Nicotinamide adenine dinucleotide, or NAD(P)H, is a metabolic cofactor and electron carrier found throughout the cytoplasm, where it serves as a critical component in glycolysis and the pentose phosphate pathway. Being a crucial component of cellular metabolism means that NAD(P)H autofluorescence is present in almost all living cells. To perform its metabolic functions, the molecule exists naturally in an oxidized (NAD+) and reduced (NAD(P)H) state. However, only NAD(P)H is fluorescence-producing. The oxidized counterpart, NAD+, does not autofluoresce. Excitation: 340 nm; Emission: 450 nm. (Sources: Chance et al. 1979; Georgakoudi et al. 2002).
2. Flavins
Commonly found in the form of flavin adenine dinucleotide (FAD), this metabolic coenzyme plays important roles in the TCA cycle and electron transport chain. It is localized primarily in the mitochondria where active metabolic processes produce hotspots of autofluorescent signal. Some researchers prefer to refer to autofluorescence from flavins as “flavoprotein fluorescence” as FAD is functionally bound to protein complexes in the mitochondria like succinate dehydrogenase. In an opposite situation to NAD(P)H, only the oxidized form of FAD is fluorescence producing while the reduced form is not. Excitation: 380-490 nm; Emission: 520–560 nm. (Sources: Chance et al. 1979; Deyl et al. 1980).
3. Collagen
Collagen is a key mechanical protein that can be assembled to create various supporting structural matrices for most tissues. It can be encountered in the dermis of skin, the extracellular matrix of internal organs, and surrounding vasculature. It comprises tendons, ligaments, hair, and fingernails too. While collagen is seldom seen in cell cultures, researchers using in vivo samples or whole tissues for their imaging experiments will likely find collagen unavoidable. Excitation: 270 nm; Emission: 390 nm. (Source: Georgakoudi et al. 2002).
4. Elastin
Another prominent extracellular matrix (ECM) protein, elastin is often interspersed with collagen to give extracellular matrices more mechanical extensibility. Elastin is densely located around vasculature that experiences frequent elastic deformation to deal with changes in blood pressure. It’s also found in the skin where pliability is necessary to complement movement from underlying bones and muscles. Once again, researchers imaging in vivo samples or whole tissues must be aware of the autofluorescence caused by structural protein like elastin. Excitation: 350–450 nm; Emission: 420–520 nm. (Source: Deyl et al. 1980).
5. Lipofuscin
A rather muddled autofluorescent molecule, lipofuscin can be found comprising small yet vibrant structures in the fluorescence spectra of neurons, glial cells, skeletal muscle cells, and cardiac muscle cells, among others. Lipofuscin can be recognized in both cell cultures and whole tissues. It has been noted to become progressively more apparent as a sample experiences biological aging. While the name may imply that a lipid or lipoprotein is responsible, the autofluorescence signal from lipofuscin has been attributed to an amalgamation of proteins, carbohydrates, and lipids. Excitation: 345–490 nm; Emission: 460–670 nm. (Source: Billinton and Knight 2001).
6. Tryptophan
An essential amino acid and a required precursor to signaling molecules like serotonin and melatonin that can be encountered in neurological research, tryptophan is a staple component of protein biosynthesis. Its omnipresence can’t be understated, as tryptophan residues can be found in most folded proteins and its autofluorescence signal subsequently permeates cells and tissues alike. As its structural chemistry is tied into protein conformations, tryptophan autofluorescence has been observed to change in wavelength and intensity as a function of changes to protein structure and binding status. Excitation: 280 nm; Emission: 350 nm. (Source: Ghisaidoobe and Chung 2014).
7. Melanin
Melanin is a natural pigment that contributes to the coloration of skin, hair, and eyes. Produced by cells in the basal epidermis of skin, melanin acts as a photoprotective molecule preventing the sun’s UV light from damaging the valuable proteins and DNA in outwardly facing skin cells. Unless you’re culturing melanocytes directly, melanin requires the most consideration for experiments that image through the skin as its natural concentration and distribution can vary even within the same samples. Excitation: 340–400 nm; Emission: 360–560 nm. (Source: Gallas and Eisner 1987).
Fluorescence from Sample Preparation
The above sources radiate photons naturally from biological tissues. Many researchers also encounter fluorescence from nonbiological components or reagents required to prepare samples in the lab.
For example, the plastic bottoms in petri dishes, well plates, and cell culture flasks can fluoresce brightly and over a broad spectrum. We recommend using glass bottom or specifically nonfluorescent polymer containers whenever you need to perform fluorescence imaging of biological samples. Phenol red, a common additive to cell culture media, can also significantly increase background fluorescence when imaging live cells. This can be easily avoided by changing your media to a phenol red-free alternative before beginning any imaging experiments.
Paper labels or stickers can cause similar problems, as paper is highly fluorescent. When using paper labels on containers or slides, keep the labels out of the way of samples that you plan to image.
Finally, aldehyde fixatives are commonly used in dying or staining protocols. Reagents such as glutaraldehyde or formaldehyde react with proteins to create fluorescent crosslinks throughout cells and tissues. Replace them with non-aldehyde fixatives to prevent an accumulation of unintended fluorescence signal.
While these examples aren’t naturally occurring sources of autofluorescence, understanding their origin and impact can prevent unwanted effects on image data.
How to Manage Unwanted Autofluorescence in an Imaging Experiment
So far we’ve established a few autofluorophores and where to find them. Now a question arises. How can you manage these signals before starting an imaging experiment?
In simple tissues or monocellular cultures, carefully choose the excitation and emission spectra of commercial stains and find accompanying narrow filters that avoid major autofluorescence peaks. Doing so can greatly boost your signal-to-noise ratio.
If your protocol allows for it, choose high quantum efficiency stains or experiment with increased concentrations of contrast agent. This can also boost the signal, albeit at a higher cost. Modern strategies use near-infrared (NIR) excitation light with labels excitable over 700 nm (e.g., Cy7 or Alexa Fluor 750) to avoid excitation and emission ranges of frequently encountered autofluorophores (Figure 2).
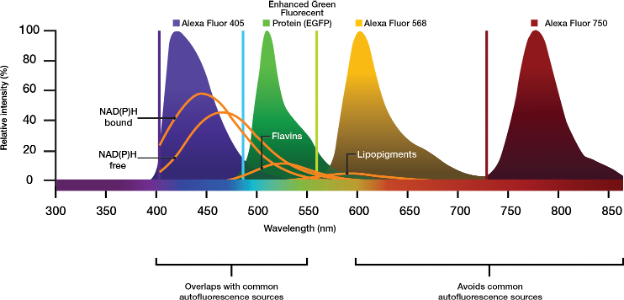
Figure 2. Emission peaks of Alexa commercial fluorophores relative to autofluorescent molecules common in biological imaging. Choosing contrast agents that excite and emit in the NIR range can avoid unwanted emissions from autofluorescent contributors.
If flexibility is allowed, investigate if alternate imaging modalities might work for your experiments. For thick samples or tissues, confocal or multiphoton microscopy systems can minimize the overall autofluorescence contribution. They do so by eliminating the collection of out-of-focus light or limiting excitation to the focal plane, respectively.
Techniques such as bioluminescence imaging completely remove the chance for autofluorophores to contribute signal to your collected data. Luminescence experiments do not require excitation light for the chemiluminescent reactions to produce emission photons, leaving autofluorophores unstimulated.
When autofluorescence signal contribution can’t be mitigated before imaging, post-acquisition image processing techniques, like spectral demixing or background subtraction, can be effective alternatives. These computational techniques require researchers to tease out the endogenous fluorophores in their samples or have predicate knowledge about the autofluorescence spectra to remove the contribution effectively.
Related Content
Imaging Intracellular Localization of Protein-to-Protein Interactions Using NanoBiT® Technology