Derivative Filters
Derivative Filters - Java Tutorial
Derivative filters provide a quantitative measurement for the rate of change in pixel brightness information present in a digital image. When a derivative filter is applied to a digital image, the resulting information about brightness change rates can be used to enhance contrast, detect edges and boundaries, and to measure feature orientation.
The tutorial initializes with a randomly selected specimen image (captured in the microscope) appearing in the left-hand window entitled Specimen Image. Each specimen name includes, in parentheses, an abbreviation designating the contrast mechanism employed in obtaining the image. The following nomenclature is used: (FL), fluorescence; (BF), brightfield; (DF), darkfield; and (POL), polarized light. Visitors will note that specimens captured using the various techniques available in optical microscopy behave differently during image processing in the tutorial.
Positioned to the right of the Specimen Image window is the Output Image window that displays the specimen image after a derivative filter has been applied. To operate the tutorial, select an image from the Choose A Specimen pull-down menu, and select a derivative filter from the Sobel Operation pull-down menu. Visitors should explore the effects that the various Sobel operations have on the appearance of the output image.
The Sobel derivative filter is based on a convolution operation that can produce a derivative in any of eight directions depending upon the choice of a 3 × 3 kernel mask. These convolutions are very useful for edge enhancement of digital images captured in the microscope. Edges are often one of the most important features in a microscopic structure, and can often be utilized for measurements after appropriate enhancement algorithms have been applied. Two examples of Sobel derivative kernel masks are illustrated below:
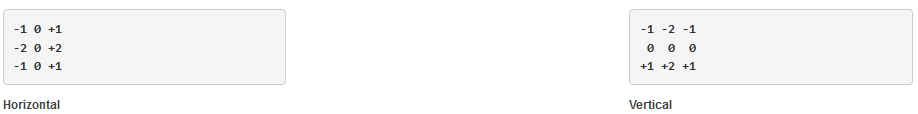
Convolution of the specimen image with the former of the two kernel masks listed above amounts to a horizontal derivative filtering operation, while convolution with the latter amounts to a vertical derivative filtering operation. For notational purposes, if B(x, y) is the brightness value of a pixel located at the coordinates (x, y) in an image, then the horizontal and vertical finite partial derivatives of B represent the relative change in brightness in each direction and can be denoted respectively as:

and

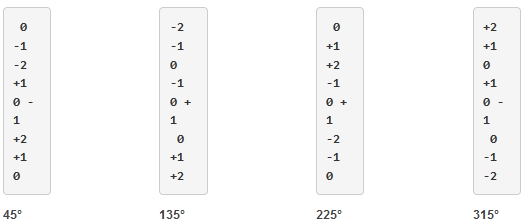
The derivative images produced through convolution with Sobel and related kernel masks are grayscale images that encode high-frequency spatial detail in the direction of interest as sharp transitions in brightness between light and dark. In the tutorial, examples of Sobel filters include the Horizontal Edges and Vertical Edges options in the Sobel Operation pull-down menu. Often, microscopists apply derivative filters from a 45-degree angle to simulate differential interference contrast (DIC) images. Examples of these filters are listed below and are available in the Sobel Operation pull-down menu.
Sobel Derivative Filters for DIC Effects
The Sobel derivatives in two orthogonal directions may be combined as the square root of the sums of their squares to obtain a measure of their magnitude that is independent of orientation. This measure is called the Sobel operator. The Sobel operator provides excellent boundary enhancement, and is one of the most commonly used methods for this purpose. This operation is illustrated in the All Edges option in the Sobel Operation pull-down menu of the tutorial.
It is also possible to calculate an angular direction for each pixel occurring in a gradient (or along an edge) with the Sobel operator. This is accomplished by determining the arc tangent of the ratio of the brightness value partial derivatives, as illustrated in the equation below:
When angle measure is scaled to the display grayscale range, the resulting image provides an indication of direction for every pixel. Because each pixel is displayed according to its direction alone, the visual impression of this image can be overwhelming, but not very informative. A more satisfactory representation can be obtained when the direction information is scaled according to the corresponding magnitude information to produce an image that shows both the edges and their orientation. In the tutorial, this corresponds to the Edge Direction (Intensity) option of the Sobel Operator pull-down menu. In addition, the HSI color space can be used to obtain a color-coded representation of the magnitude and direction information. The angular direction information can be represented by the hue component of HSI, and the magnitude information can be represented by the intensity component. This representation corresponds to the Edge Direction (Hue) option of the Sobel Operator pull-down menu in the tutorial. When the hue image is converted to binary by thresholding according to a range of hues (not addressed in the tutorial), a pixel count for each color (direction) can be obtained for the purpose of edge analysis.
Sorry, this page is not
available in your country.