A natural image captured with a camera, telescope, microscope, or other type of optical instrument displays a continuously varying array of shades and color tones. Photographs made with film, or video images produced by a vidicon camera tube, are a subset of all possible images and contain a wide spectrum of intensities, ranging from dark to light, and a spectrum of colors that can include just about any imaginable hue and saturation level. Images of this type are referred to as continuous-tone because the various tonal shades and hues blend together without disruption to generate a faithful reproduction of the original scene.
Continuous-tone images are produced by analog optical and electronic devices, which accurately record image data by several methods, such as a sequence of electrical signal fluctuations or changes in the chemical nature of a film emulsion that vary continuously over all dimensions of the image. In order for a continuous-tone or analog image to be processed or displayed by a computer, it must first be converted into a computer-readable form or digital format. This process applies to all images, regardless the origin and complexity, and whether they exist as black and white (grayscale) or full color. Because grayscale images are somewhat easier to explain, they will serve as a primary model in many of the following discussions.
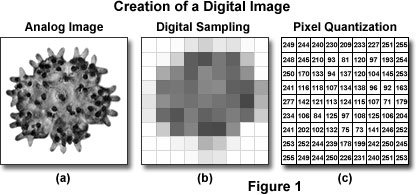
To convert a continuous-tone image into a digital format, the analog image is divided into individual brightness values through two operational processes that are termed sampling and quantization, as illustrated in Figure 1. The analog representation of a miniature young starfish imaged with optical microscope is presented in Figure 1(a). After sampling in a two-dimensional array (Figure 1(b)), brightness levels at specific locations in the analog image are recorded and subsequently converted into integers during the process of quantization (Figure 1(c)). The target objective is to convert the image into an array of discrete points that each contain specific information about brightness or tonal range and can be described by a specific digital data value in a precise location. The sampling process measures the intensity at successive locations in the image and forms a two-dimensional array containing small rectangular blocks of intensity information. After sampling is completed, the resulting data is quantized to assign a specific digital brightness value to each sampled data point, ranging from black, through all of the intermediate gray levels, to white. The result is a numerical representation of the intensity, which is commonly referred to as a picture element or pixel, for each sampled data point in the array.
Because images are generally square or rectangular in dimension, each pixel that results from image digitization is represented by a coordinate-pair with specific x and y values arranged in a typical Cartesian coordinate system. The x coordinate specifies the horizontal position or column location of the pixel, while the y coordinate indicates the row number or vertical position. By convention, the pixel positioned at coordinates (0,0) is located in the upper left-hand corner of the array, while a pixel located at (158,350) would be positioned where the 158th column and 350th row intersect. In many cases, the x location is referred to as the pixel number, and the y location is known as the line number. Thus, a digital image is composed of a rectangular (or square) pixel array representing a series of intensity values and ordered through an organized (x,y) coordinate system. In reality, the image exists only as a large serial array of numbers (or data values) that can be interpreted by a computer to produce a digital representation of the original scene.
Aspect Ratio
The horizontal-to-vertical dimensional ratio of a digital image is referred to as the aspect ratio of the image and can be calculated by dividing the horizontal width by the vertical height. The recommended NTSC (National Television Systems Committee) commercial broadcast standard aspect ratio for television and video equipment is 1.33, which translates to a ratio of 4:3, where the horizontal dimension of the image is 1.33 times wider than the vertical dimension. In contrast, an image with an aspect ratio of 1:1 (often utilized in closed circuit television or CCTV) is perfectly square. By adhering to a standard aspect ratio for display of digital images, gross distortion of the image, such as a circle appearing as an ellipse, is avoided when the images are displayed on remote platforms.

The 4:3 aspect ratio standard, widely utilized for television and computer monitors, produces a display that is four units wide by three units high. For example, a 32-inch television (measured diagonally from the lower left-hand corner to the upper right-hand corner) is 25.6 inches wide by 19.2 inches tall. The standard aspect ratio for digital high-definition television (HDTV) is 16:9 (or 1.78:1), which results in a more rectangular screen. Sometimes referred to as widescreen format (see Figure 2), the 16:9 aspect ratio is a compromise between the standard broadcast format and that commonly utilized for motion pictures. This ratio has been determined to provide the best compromise at eliminating or decreasing the size of black bars for letterbox format videos, while minimizing the size of bars required to fit traditional 4:3 broadcasts into screens using the wider format.
The high-definition television aspect ratio has become a new standard for use with digital television broadcasts, and results from an effort to create wider television screens that also are useful for motion picture formats. Recently, an even wider format (2.35:1) has emerged for videos made with Panavision wide screen lenses. Also termed widescreen, this format is common in motion pictures that have been transferred to digital videodisk (DVD) software (movies or videos) for home viewing. Note that the term "DVD" also refers to digital versatile disk when used in reference to the DVD-ROM format for storage of data.
When a continuous-tone image is sampled and quantized, the pixel dimensions of the resulting digital image acquire the aspect ratio of the original analog image. In this regard, it is important that each individual pixel has a 1:1 aspect ratio (referred to as square pixels) to ensure compatibility with common digital image processing algorithms and to minimize distortion. If the analog image has a 4:3 aspect ratio, more samples must be taken in the horizontal direction than in the vertical direction (4 horizontal samples for each 3 vertical samples). Analog images having other aspect ratios require similar consideration when being digitized.
Spatial Resolution
The quality of a digital image, often referred to as image resolution, is determined by the number of pixels and the range of brightness values available for each pixel utilized in the image. Resolution of the image is regarded as the capability of the digital image to reproduce fine details that were present in the original analog image or scene. In general, the term spatial resolution is reserved to describe the number of pixels utilized in constructing and rendering a digital image. This quantity is dependent upon how finely the image is sampled during acquisition or digitization, with higher spatial resolution images having a greater number of pixels within the same physical dimensions. Thus, as the number of pixels acquired during sampling and quantization of a digital image increases, the spatial resolution of the image also increases.
The sampling frequency, or number of pixels utilized to construct a digital image, is determined by matching the optical and electronic resolution of the imaging device (usually a CCD or CMOS image sensor) and the computer system utilized to visualize the image. A sufficient number of pixels should be generated by sampling and quantization to faithfully represent the original scanned or optically acquired image. When analog images are inadequately sampled, a significant amount of detail can be lost or obscured, as illustrated by the diagrams in Figure 3. The original analog signal presented in Figure 3(a) can represent either a scanned image derived from a photograph, or an optical image generated by a camera or microscope. Note the continuous intensity distribution displayed by the original image before sampling and digitization when plotted as a function of sample position. In this example, when 32 digital samples are acquired (Figure 3(b)), the resulting image retains a majority of the characteristic intensities and spatial frequencies present in the original analog image.
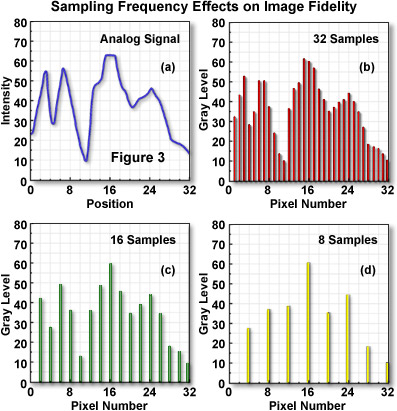
However, when the sampling frequency is reduced (Figure 3(c) and Figure 3(d)), some information (frequencies) present in the original analog image are missed in the translation from analog to digital, and a phenomenon commonly referred to as aliasing begins to develop. As is evident in Figure 3(d), which represents the digital image with the lowest number of samples, aliasing has produced a loss of high spatial frequency data while simultaneously introducing spurious lower frequency data that does not actually exist. This effect is manifested by the loss of peaks and valleys in areas between position 0 and 16 in the original analog image when compared to the digital image in Figure 3(d). In addition, the peak present at position 3 in the analog image has become a valley in Figure 3(d), while the valley at position 12 is being interpreted as the slope of a peak in the lower resolution digital image.
The spatial resolution of a digital image is related to the spatial density of the image and the optical resolution of the microscope or other optical device utilized to capture the image. The number of pixels contained in a digital image and the distance between each pixel (known as the sampling interval) are a function of the accuracy of the digitizing device. The optical resolution is a measure of the optical lens system's (microscope or camera) ability to resolve the details present in the original scene, and is related to the quality of the optics, image sensor, and electronics. In conjunction with the spatial density (the number of pixels in the digital image), the optical resolution determines the overall spatial resolution of the image. In situations where the optical resolution of the optical imaging system is superior to the spatial density, then the spatial resolution of the resulting digital image is limited only by the spatial density.
Digital Image Sampling Frequency
Discover how variations in specimen sampling frequency affect the resolution of the final digital image during acquisition or processing by an analog-to-digital converter.
All details contained in a digital image, ranging from very coarse to extremely fine, are composed of brightness transitions that cycle between various levels of light and dark. The cycle rate between brightness transitions is known as the spatial frequency of the image, with higher rates corresponding to higher spatial frequencies. Varying levels of brightness in minute specimens observed through the microscope are common, with the background usually consisting of a uniform intensity and the specimen exhibiting a spectrum of brightness levels. In areas where the intensity is relatively constant (such as the background), the spatial frequency varies only slightly across the viewfield. Alternatively, many specimen details often exhibit extremes of light and dark with a wide gamut of intensities in between.
The numerical value of each pixel in the digital image represents the intensity of the optical image averaged over the sampling interval. Thus, background intensity will consist of a relatively uniform mixture of pixels, while the specimen will often contain pixels with values ranging from very dark to very light. The ability of a digital camera system to accurately capture all of these details is dependent upon the sampling interval. Features seen in the microscope that are smaller than the digital sampling interval (have a high spatial frequency) will not be represented accurately in the digital image. The Nyquist criterion requires a sampling interval equal to twice the highest specimen spatial frequency to accurately preserve the spatial resolution in the resulting digital image. An equivalent measure is Shannon's sampling theorem, which states that the digitizing device must utilize a sampling interval that is no greater than one-half the size of the smallest resolvable feature of the optical image. Therefore, to capture the smallest degree of detail present in a specimen, sampling frequency must be sufficient so that two samples are collected for each feature, guaranteeing that both light and dark portions of the spatial period are gathered by the imaging device.
If sampling of the specimen occurs at an interval beneath that required by either the Nyquist criterion or Shannon theorem, details with high spatial frequency will not be accurately represented in the final digital image. In the optical microscope, the Abbe limit of resolution for optical images is 0.22 micrometers, meaning that a digitizer must be capable of sampling at intervals that correspond in the specimen space to 0.11 micrometers or less. A digitizer that samples the specimen at 512 points (or pixels) per horizontal scan line would produce a maximum horizontal field of view of about 56 micrometers (512 × 0.11 micrometers). If too few pixels are utilized in sample acquisition, then all of the spatial details comprising the specimen will not be present in the final image. Conversely, if too many pixels are gathered by the imaging device (often as a result of excessive optical magnification), no additional spatial information is afforded, and the image is said to have been oversampled. The extra pixels do not theoretically contribute to the spatial resolution, but can often help improve the accuracy of feature measurements taken from a digital image. To ensure adequate sampling for high-resolution imaging, an interval of 2.5 to 3 samples for the smallest resolvable feature is suggested.
A majority of digital cameras coupled to modern microscopes and other optical instruments have a fixed minimum sampling interval, which cannot be adjusted to match the specimen's spatial frequency. It is important to choose a camera and digitizer combination that can meet the minimum spatial resolution requirements of the microscope magnification and specimen features. If the sampling interval exceeds that necessary for a particular specimen, the resulting digital image will contain more data than is needed, but no spatial information will be lost.
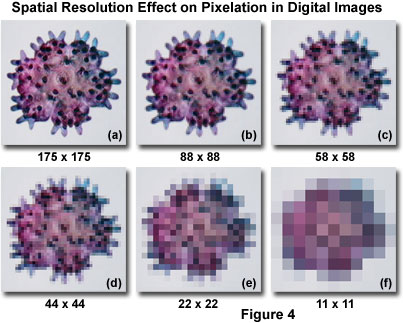
The effect on digital images of sampling at varying spatial resolutions is presented in Figure 4 for a young starfish specimen imaged with an optical microscope. At the highest spatial resolution (Figure 4(a); 175 × 175 pixels for a total of 30,625 pixels), the specimen features are distinct and clearly resolved. As the spatial resolution is decreased (Figures 4(b)-4(f)), the pixel size becomes increasingly larger. Specimen details sampled at the successively lower spatial frequencies result in lost image detail. At the lowest sampling frequencies (Figures 4(e) and 4(f)), pixel blocking occurs (often referred to as pixelation) and masks most of the image features.
Many entry-level digital cameras designed to be coupled to an optical microscope contain a image sensor having pixel dimensions around 7.6 square microns, which produces a corresponding image area of 4.86 × 3.64 millimeters on the surface of the photodiode array when the sensor is operating in VGA mode. The resulting digital image size is 640 × 480 pixels, which equals 307,200 individual sensor elements. The ultimate resolution of a digital image sensor is a function of the number of photodiodes and their size relative to the image projected onto the surface of the array by the microscope optics. Acceptable resolution of a specimen imaged with a digital microscope can only be achieved if at least two samples are made for each resolvable unit. The numerical aperture of lower-end microscopes ranges from approximately 0.05 at the lowest optical magnification (0.5x) to about 0.95 at the highest magnification (100x without oil). Considering an average visible light wavelength of 550 nanometers and an optical resolution range between 0.5 and 7 microns (depending upon magnification), the sensor element size is adequate to capture all of the detail present in most specimens at intermediate to high magnifications without significant sacrifice in resolution.
Spatial Resolution
Explore how significant variations in the spatial resolution of digital images can have dramatic effects on the final appearance of the final image. The tutorial examines images collected with a variety of contrast enhancing illumination techniques.
A serious sampling artifact, known as spatial aliasing, occurs when details present in the analog image or actual specimen are sampled at a rate less than twice their spatial frequency. This phenomenon, also commonly termed undersampling, typically occurs when the pixels in the digitizer are spaced too far apart compared to the high-frequency detail present in the image. As a result, the highest frequency information necessary to accurately render analog image details can masquerade as lower spatial frequency features that are not actually present in the digital image. Aliasing usually occurs as an abrupt transition when the sampling frequency drops below a critical level, which is about 1.5 times that of repetitive high-frequency specimen patterns, or about 25 percent below the Nyquist resolution limit. Specimens containing regularly spaced, repetitive patterns often exhibit moiré fringes that result from aliasing artifacts induced by undersampling.
Image Brightness and Bit Depth
The brightness (or luminous brightness) of a digital image is a measure of relative intensity values across the pixel array after the image has been acquired with a digital camera or digitized by an analog-to-digital converter. Brightness should not be confused with intensity (more accurately termed radiant intensity), which refers to the magnitude or quantity of light energy actually reflected from or transmitted through the object being imaged by an analog or digital device. Instead, in terms of digital image processing, brightness is more properly described as the measured intensity of all the pixels comprising an ensemble that constitutes the digital image after it has been captured, digitized, and displayed. Pixel brightness is an important factor in digital images, because (other than color) it is the only variable that can be utilized by processing techniques to quantitatively adjust the image.
After an object has been imaged and sampled, each resolvable unit is represented either by a digital integer (provided the image is captured with a digital camera system) or by an analog intensity value on film (or a video tube). Regardless of the capture method, the image must be digitized to convert each continuous-tone intensity represented within the specimen into a digital brightness value. The accuracy of the digital value is directly proportional to the bit depth of the digitizing device. If two bits are utilized, the image can only be represented by four brightness values or levels. Likewise, if three or four bits are processed, the corresponding images have eight and 16 brightness levels, respectively (see Figure 5). In all of these cases, level 0 represents black, while the upper level (3, 7, or 15) represents white, and each intermediate level is a different shade of gray.
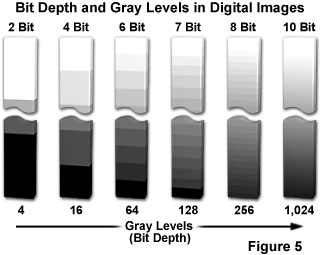
These black, white, and gray brightness levels are all combined in what constitutes the grayscale or brightness range of the image. A higher number of gray levels corresponds to greater bit depth and the ability to accurately represent a greater signal dynamic range (see Table 1). For example, a 12-bit digitizer can display 4,096 gray levels, corresponding to a sensor dynamic range of 72 db (decibels). When applied in this sense, dynamic range refers to the maximum signal level with respect to noise that the CCD sensor can transfer for image display, and can be specifically defined in terms of pixel signal capacity and sensor noise characteristics. Similar terminology is commonly used to describe the range of gray levels utilized in creating and displaying a digital image, which may be represented by the intensity histogram. This usage is clarified if specifically referred to as intrascene dynamic range. Color images are constructed of three individual channels (red, green, and blue) that have their own "gray" scales consisting of varying brightness levels for each color. The colors are combined within each pixel to represent the final image.
In computer technology a bit (contraction for binary digit) is the smallest unit of information in a notation utilizing the binary mathematics system (composed only of the numbers 1 and 0). A byte is commonly constructed with a linear string of 8 bits and is capable of storing 256 integer values (2•E(8)). In the same manner, two bytes (equal to 16 bits or one computer word) can store 2•(E16) integer numbers, ranging from 0 to 65,535. One kilobyte (abbreviated Kbyte) equals 1024 bytes, while one megabyte (Mbyte) equals 1024 kilobytes. In most computer circuits, a bit is physically associated with the state of a transistor or capacitor in a memory cell or a magnetic domain on a hard drive platter.
Gray-Level Resolution
Examine the effects of varying bit depth resolution on the appearance of digital images captured with the optical microscope. Grayscale images can be altered between the range of 1-bit and 7-bits with this interactive tutorial.
The term bit depth refers to the binary range of possible grayscale values utilized by the analog-to-digital converter to translate analog image information into discrete digital values capable of being read and analyzed by a computer. For example, the most popular 8-bit digitizing converters have a binary range of 2•(E8) or 256 possible values (Figure 5), while a 10-bit converter has a range of 2•(E10) (1,024 values), and a 16-bit converter has 2•(E16), or 65,536 possible values. The bit depth of the analog-to-digital converter determines the size of the gray scale increments, with higher bit depths corresponding to a greater range of useful image information available from the camera.
Presented in Table 1 is the relationship between the number of bits used to store digital information, the numerical equivalent in grayscale levels, and the corresponding value for sensor dynamic range (in decibels; one bit equals approximately 6 dB). As illustrated in the table, if a 0.72-volt video signal were digitized by an A/D converter with 1-bit accuracy, the signal would be represented by two values, binary 0 or 1 with voltage values of 0 and 0.72 volts. Most digitizers found in digital cameras used in consumer and low-end scientific applications employ 8 bit A/D converters, which have 256 discrete grayscale levels (between 0 and 255), to represent the voltage amplitudes. A maximum signal of 0.72 volts would then be subdivided into 256 steps, each step having a value of 2.9 millivolts.
Bit Depth, Gray Levels, and Sensor Dynamic Range
| Bit Depth | Grayscale Levels | Dynamic Range (Decibels) |
| 1 | 2 | 6 dB |
| 2 | 4 | 12 dB |
| 3 | 8 | 18 dB |
| 4 | 16 | 24 dB |
| 5 | 32 | 30 dB |
| 6 | 64 | 36 dB |
| 7 | 128 | 42 dB |
| 8 | 256 | 48 dB |
| 9 | 512 | 54 dB |
| 10 | 1,024 | 60 dB |
| 11 | 2,048 | 66 dB |
| 12 | 4,096 | 72 dB |
| 13 | 8,192 | 78 dB |
| 14 | 16,384 | 84 dB |
| 16 | 65,536 | 96 dB |
| 18 | 262,144 | 108 dB |
| 20 | 1,048,576 | 120 dB |
Table 1
The number of grayscale levels that must be generated in order to achieve acceptable visual quality should be enough that the steps between individual gray values are not discernible to the human eye. The "just noticeable difference" in intensity of a gray-level image for the average human eye is about two percent under ideal viewing conditions. At most, the eye can distinguish about 50 discrete shades of gray within the intensity range of a video monitor, suggesting that the minimum bit depth of an image should lie between 6 and 7 bits (64 and 128 grayscale levels; see Figure 5).
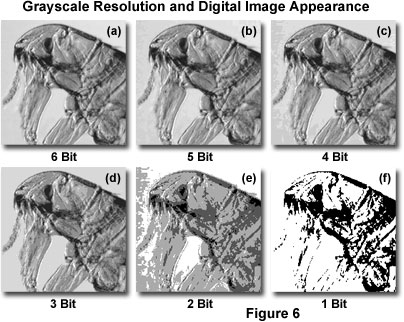
Digital images should have at least 8-bit to 10-bit resolution to avoid producing visually obvious gray-level steps in the enhanced image when contrast is increased during image processing. The effect of reducing the number of grayscale levels on the appearance of digital images captured with an optical microscope can be seen in Figure 6, which shows a black & white (originally 8-bit) image of a common flea. The specimen is displayed at various grayscale resolutions ranging from 6-bit (Figure 6(a)), down to 1-bit (Figure 6(f)) with several levels in between. At the lower resolutions (below 5-bit), the image begins to acquire a mechanical appearance having significantly less detail, with many of the specimen regions undergoing a phenomenon known as gray-level contouring or posterization. Gray-level contouring becomes apparent in the background regions first (see Figure 6(c)), where gray levels tend to vary more gradually, and is indicative of inadequate gray-level resolution. At the lowest resolutions (1-bit and 2-bit; Figure 6(e) and 6(f)) a significant number of image details are lost. For a majority of the typical applications, such as display on a computer screen or through a web browser, 6-bit or 7-bit resolution is usually adequate for a visually pleasing digital image.
Ultimately, the decision on how many pixels and gray levels are necessary to adequately describe an image is dictated by the physical properties of the original scene (or specimen in a microscope). Many low contrast, high-resolution images require a significant number of gray levels and pixels to produce satisfactory results, while other high contrast and low resolution images (such as a line drawing) can be adequately represented with a significantly lower pixel density and gray level range. Finally, there is a trade-off in computer performance between contrast, resolution, bit depth, and the speed of image processing algorithms. Images having a larger number of variables will require more computer "horsepower" than those having fewer pixels and gray levels. However, any modern computer is capable of performing complex calculations on digital images in common sizes (640 × 480 through 1280 × 1024) very quickly. Larger images, or those stored in proprietary file formats (such as a Photoshop Document - PSD) containing multiple layers, may reduce performance, but can still be processed in a reasonable amount of time on most personal computers.
Improved digital cameras with CCD and CMOS image sensors capable of 10-bit (or even 12-bit in high-end models) resolution characteristics permit the display of images with greater latitude than is possible for 8-bit images. This occurs because the appropriate software can render the necessary shades of gray from a larger palette (1,024 or 4,096 grayscale levels) for display on computer monitors, which typically present images in 256 shades of gray. In contrast, an 8-bit digital image is restricted to a palette of 256 grayscale levels that were originally captured by the digital camera. As the magnification is increased during image processing, the software can choose the most accurate grayscales to reproduce portions of the enlarged image without changing the original data. This is especially important when examining shadowed areas where the depth of a 10-bit digital image allows the software to render subtle details that would not be present in an 8-bit image.
The accuracy required for digital conversion of analog video signals is dependent upon the difference between a digital gray-level step and the root-mean-square noise in the camera output. CCD cameras with an internal analog-to-digital converter produce a digital data stream that does not require resampling and digitization in the computer. These cameras are capable of producing digital data with up to 16-bit resolution (65,536 grayscale steps) in high-end models. The major advantage of the large digital range exhibited by the more sophisticated CCD cameras lies in the signal-to-noise improvements in the displayed 8-bit image and in the wide linear dynamic range over which signals can be digitized.
Color Space Models
Digital images produced in color are governed by the same concepts of sampling, quantization, spatial resolution, bit depth, and dynamic range that apply to their grayscale counterparts. However, instead of a single brightness value expressed in gray levels or shades of gray, color images have pixels that are quantized using three independent brightness components, one for each of the primary colors. When color images are displayed on a computer monitor, three separate color emitters are employed, each producing a unique spectral band of light, which are combined in varying brightness levels at the screen to generate all of the colors in the visible spectrum.
Images captured with CCD or CMOS image sensors can be rendered in color, provided the sensor is equipped with miniature red, green, and blue absorption filters fitted over each of the photodiodes in a specific pattern. Alternatively, some digital cameras have a rotating filter wheel or employ three individual image sensors, each positioned behind a separate color filter, to generate color images. In general, all processing operations that are performed on grayscale images can be extended to color images by applying the algorithms to each color channel separately, then combining the channels. Thus, each color component is quantized and processed at a resolution equivalent to the bit depth utilized in a grayscale image (generally 8-bits). The resulting 8-bit components are then combined to produce 24-bit pixels (referred to as true color), although some applications may require a greater or lesser degree of color resolution.
The additive primary colors, red, green, and blue, can be selectively combined to produce all of the colors in the visible light spectrum. Together, these primary colors constitute a color space (commonly referred to as a color gamut) that can serve as the basis for processing and display of color digital images. In some cases, an alternate color space model is more appropriate for specific algorithms or applications, which requires only a simple mathematical conversion of the red, green, and blue (RGB) space into another color space. For example, if a digital image must be printed, it is first acquired and processed as an RGB image, and then converted into the cyan, magenta, yellow (CMY) color space necessary for three-color printing, either by the processing software application, or by the printer itself.
In general, the RGB color space is utilized by image sensors (although some employ CMY filters) to detect and generate color digital images, but other derivative color spaces are often more useful for color image processing. These color-space models represent different methods of defining color variables, such as hue, saturation, brightness, or intensity, and can be arbitrarily modified to suit the needs of a particular application. The most popular alternative color-space model is the hue, saturation, and intensity (HSI) color space, which represents color in an intuitive way (the manner in which humans tend to perceive it). Instead of describing characteristics of individual colors or mixtures, as with the RGB color space, the HSI color space is modeled on the intuitive components of color. For example, the hue component controls the color spectrum (red, green, blue, yellow, etc.), while the saturation component regulates color purity, and the intensity component controls how bright the color appears.
Numerous derivatives of the HSI color-space model have been devised, including hue, saturation, lightness (HSL), hue, saturation, brightness (HSB), and several other closely related, but not identical, models. The terms brightness, lightness, value, and intensity are often used interchangeably, but actually represent distinctively different manifestations of how bright a color appears. Each color-space model provides a color representation scheme that is tailored for a particular application.
Grayscale digital images can be rendered in pseudocolor by assigning specific gray level ranges to particular color values. This technique is useful for highlighting particular regions of interest in grayscale images because the human eye is better able to discriminate between different shades of color than between varying shades of gray. Pseudocolor imaging is widely employed in fluorescence microscopy to display merged monochrome images obtained at different wavelengths utilizing multiply stained specimens. Often, the color assigned to individual fluorophore images in a collage assembly is close in color to that naturally emitted by the fluorescent dye.
Image Histograms
The intensity or brightness of the pixels comprising a digital image can be graphically depicted in a grayscale histogram, which maps the number of pixels at each gray level present in the image. A typical grayscale digital image (captured with an optical microscope) and its corresponding histogram are presented in Figures 7(a) and 7(b), respectively. The grayscale values are plotted on the horizontal axis for the 8-bit image, and range from 0 to 255 (for a total of 256 gray levels). In a similar manner, the number of pixels comprising each gray level is plotted on the vertical axis. Each pixel in the image has a gray level corresponding to a value in the plot, so the number of pixels in each gray level column of the histogram must add to produce the total number of pixels in the image.
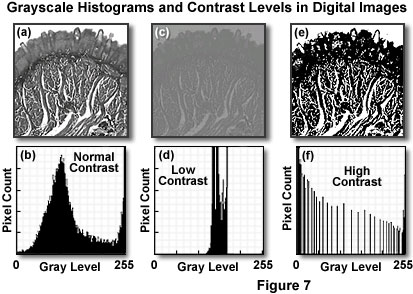
The histogram provides a convenient representation of a digital image by indicating the relative population of pixels at each brightness level and the overall intensity distribution of the image in general. Statistics derived from the histogram can be employed to compare contrast and intensity between images, or the histogram can be altered by image processing algorithms to produce corresponding changes in the image. In addition, the number of pixels in the histogram can be employed to ascertain area measurements of specific image details, or to evaluate and compare the performance of a video camera or digitizer.
Manipulating Image Histograms
Examine how redistributing brightness values through application of contrast stretching and histogram normalization algorithms can rehabilitate digital images having poor contrast.
One of the most popular and practical uses for a digital image histogram is adjustment of contrast. The grayscale histogram also reveals the extent of available gray-level range that is being utilized by a digital image. For example, a concentration of pixels falling within a 50 to 75 brightness-level range, with only a few pixels in other regions of the histogram, indicates a limited range of intensity (brightness) levels. In contrast, a well-balanced histogram (as illustrated in Figure 7(b)) is a good indicator of large intrascene dynamic range. Digital images having both high and low contrast are illustrated in Figures 7(c) through 7(f). The specimen is a stained thin section of human tissue imaged and recorded in brightfield illumination (as discussed above for Figure 7(a) and 7(b)). Figure 7(c) presents the situation where image contrast is very low, resulting in a majority of the pixels being grouped in the center of the histogram (Figure 7(d)), severely limiting the dynamic range (and contrast). When the contrast is shifted in the opposite direction (Figure 7(f)), most of the pixels are grouped bimodally into the highest and lowest gray levels, leaving the center levels relatively unpopulated. This distribution corresponds to very high contrast levels, resulting in digital images that have an overabundance of white and black pixels, but relatively few intermediate gray levels (see Figure 7(e)). From these examples, it is clear that the digital image histogram is a powerful indicator of image fidelity and can be utilized to determine the necessary steps in image rehabilitation.
Histograms of color digital images are a composite of three grayscale histograms that are computed and displayed for each color component (usually red, green, and blue). Color histograms can represent RGB color-space, HSI models, or any other color space model necessary for digital image processing algorithms. These histograms can be displayed simultaneously in a superimposed fashion, or segregated into individual graphs to help determine brightness distributions, contrast, and dynamic ranges of the individual color components.
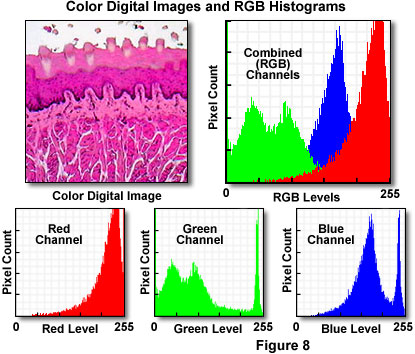
Presented in Figure 8 is a typical full color digital image captured with an optical microscope. The specimen is a thin section of mammalian taste buds stained with eosin and hematoxylin and imaged under brightfield illumination mode. Appearing to the right of the digital image is the RGB histogram, which contains superimposed pixel distributions for the three (red, green, and blue) color channels. Beneath the digital image and the RGB histogram are individual histograms representing the red, green, and blue channels, respectively. Note that the distribution of intensity levels is highest in the red channel, which corresponds to the rather pronounced dominance of reddish tones in the digital image. The bimodal green channel indicates a large degree of contrast in this color channel, while the blue channel presents a histogram having a relatively well-distributed intensity range.
Digital Image Display
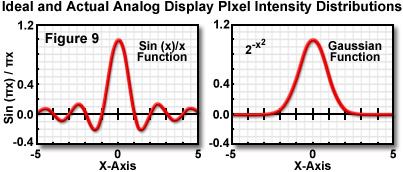
In order to recreate a digital image on an analog computer monitor (or television), the pixel intensities must be interpolated without significant loss of spatial information. In theory, this can only be achieved using a display system where the pixel elements are presented using a sin(x)/x function (see Figure 9), which is a complex two-dimensional waveform having zero intensities at all locations throughout the image. This requirement presents a problem with analog display systems that utilize an electron gun, because the required function cannot be adequately generated with a standard computer monitor. After conversion back to an analog signal by a digital-to-analog converter, the scanning spot on a video monitor closely resembles a Gaussian distribution function (Figure 9). The two functions resemble each other only through the central maximum, and applications for digital display can result in potentially serious amplitude and waveform alterations that obscure high-resolution information present in the image.
The solution to combat computer monitor display inadequacies is to increase the number of pixels in the digital image while simultaneously employing a high-resolution monitor having a frequency response (video bandwidth) exceeding 20 megahertz. Even relatively low-end modern computer monitors satisfy these requirements, and images can always be increased in pixel density through interpolation techniques (although this is not always advisable). Another approach is to oversample the analog image (beyond the Nyquist limit) to ensure enough pixel data for complex image processing algorithms and subsequent display.
The refresh rate of video displays is also an important factor in viewing and manipulating digital images. Display flicker is a serious artifact that can fatigue the eyes over even a short period of time. To avoid flicker artifacts, television displays utilize an interlaced scan technique that refreshes odd- and even-numbered lines sequentially, resulting in an interleaved effect. Interlacing presents the impression that a new frame is generated twice as often as it really is. Originally, interlacing was utilized for television broadcast signals because the display could be refreshed less frequently without noticeable image flicker.
Modern computer monitors employ a non-interlaced scanning technology (also known as progressive scan), which displays the entire video buffer in a single scan. Progressive scan monitors require frame rates that operate at twice the frequency of interlaced devices to avoid flicker artifacts. However, the technique eliminates line-to-line flicker and reduces motion artifacts in displayed images. Modern computer monitors generally have user-adjustable progressive scan rates ranging from 60 to over 100 frames per second, which can present very steady images that are virtually flicker-free.
Digital Image Storage Requirements
In order to conserve storage resources, the individual pixel coordinates of digital images are not stored in common computer file formats. This is because images are digitized in sequential order by raster scanning or array readout of either an analog or optical image by the digitizing device (CCD, scanner, etc.), which transfers data to the computer in a serial string of pixel brightness values. The image is then displayed by incremental counting of pixels, according to the established image vertical and horizontal dimensions, which are usually recorded in the image file header.
The characteristics of digital images can be expressed in several manners. For instance, the number of pixels in a given length dimension (such as pixels per inch) can be specified, or the pixel array size (for example, 640 × 480) can be used to describe the image. Alternatively, the total number of image pixels or the computer storage file size gives an indication of the image dimensions. File sizes, in bytes, can be determined by multiplying the pixel dimensions by the bit depth and dividing that number by 8, the number of bits per byte. For example, a 640 × 480 (pixel) image having 8-bit resolution would translate into 302 kilobytes of computer memory (see Table 2). Likewise a high-resolution 1280 × 1024 true color image with 24-bit depth requires over 3.8 megabytes of storage space.
Digital image file size as a function of pixel dimensions, format, and bit depth is presented for a wide range of images in Table 2. Uncompressed file formats, such as tagged image file format (TIFF) and "Windows" image bitmaps (BMP), require the most hard drive space when encoded in full color. In contrast, common compression algorithms, including the popular Joint Photographic Experts Group (JPEG) technique, can dramatically reduce storage requirements while maintaining a reasonable degree of image quality. Pixel depth and the target output requirements are also important factors in determining how digital images should be stored. Images destined for printed media require high pixel resolutions (often exceeding 300 pixels per inch), while those intended for distribution over the Internet benefit from reduced resolution (around 72 pixels per inch) and file size.
Digital File Format Memory Requirements
| Pixel Dimensions | Grayscale (8-Bit) | Bitmap (24-Bit) | JPEG (24-Bit) | TIFF (24-Bit) |
| 16 × 16 | 2k | 2k | 2k | 2k |
| 64 × 64 | 6k | 13k | 5k | 13k |
| 128 × 128 | 18k | 49k | 12k | 49k |
| 256 × 256 | 66k | 193k | 22k | 193k |
| 320 × 240 | 77k | 226k | 24k | 226k |
| 512 × 512 | 258k | 769k | 52k | 770k |
| 640 × 480 | 302k | 901k | 56k | 902k |
| 800 × 600 | 470k | 1,407k | 75k | 1,408k |
| 1024 × 768 | 770k | 2,305k | 104k | 2,306k |
| 1280 × 1024 | 1,282k | 3,841k | 147k | 3,842k |
| 1600 × 1200 | 1,877k | 5,626k | 161k | 5,627k |
| 2250 × 1800 | 3,960k | 11,869k | 276k | 11,867k |
| 3200 × 2560 | 8,002k | 24,001k | 458k | 24,002k |
| 3840 × 3072 | 11,522k | 34,561k | 611k | 34,562k |
Table 2
With the current availability of relatively low-cost computer memory (RAM), coupled to dramatically improved capacity and speed, storage of digital images is of far less concern than it has been in the past. Large digitized arrays, up to 1024 × 1024 pixels with 10, 12, or 16-bit depths, can now be stored and manipulated on personal computers at high speeds. In addition, dozens of smaller (640 × 480, 8-bit) images can be stored as stacks and rapidly accessed for playback as video-rate videos using commercially available software, or for simultaneous image processing.
Multiple digital images obtained through optical section confocal and multiphoton microscopy techniques, or captured in sequences using CCD or CMOS image sensors, can be rapidly displayed and manipulated. Projections of an optical section stack along two appropriately tilted axes yields the common stereo pair, which can be employed to visualize a pseudo three-dimensional rendition of a microscopic scene. Current digital image processing software packages allow a variety of simple display strategies to be employed to visualize objects through intensity-coded or pseudocolor assignments. When multiple images are recorded in successive time points, images can be displayed as two-dimensional "movies" or combined to generate four-dimensional images in which a three-dimensional object is depicted as a function of time.
Advanced digital image processing techniques and display manipulation may be employed to produce remarkable images of three-dimensional objects by rendering a view of the object with appropriate shading, coloring, and depth cues. Two popular techniques generally applied to render the optical sections for display in three-dimensions are volume rendering and surface rendering. In volume rendering of an optical image set, the two-dimensional pixel geometry and intensity information is combined with the known focal displacements to generate volume elements, termed voxels. The resulting voxels are then appropriately shaded and projected to produce a view of the specimen volume with associated perspective and lighting to produce a three-dimensional representation. In surface rendering of an image set, only the surface pixels are utilized, representing the outside surface of the specimen, and the interior structure is not visible because of the surface opacity. Again, lighting, perspective, and depth cues are essential to the production of a visually acceptable rendition.


