Automated Analysis of Label-Free Organoid Imaging Data
Establish efficient label-free image batch analysis workflows to measure organoid drug responses
Introduction
3D in vitro models, such as spheroids and organoids, provide researchers with a more physiologically relevant microenvironment to study than traditional 2D cell culture models. However, creating an efficient workflow for measuring organoid responses can be challenging.
In this study, we used cellSens software’s macro function to make batch image analysis workflows for label-free organoid data. We then compared the results to a CellTiter-Glo 3D cell viability assay to assess the analysis speed and determine the accuracy and sensitivity of object detection and measurement.
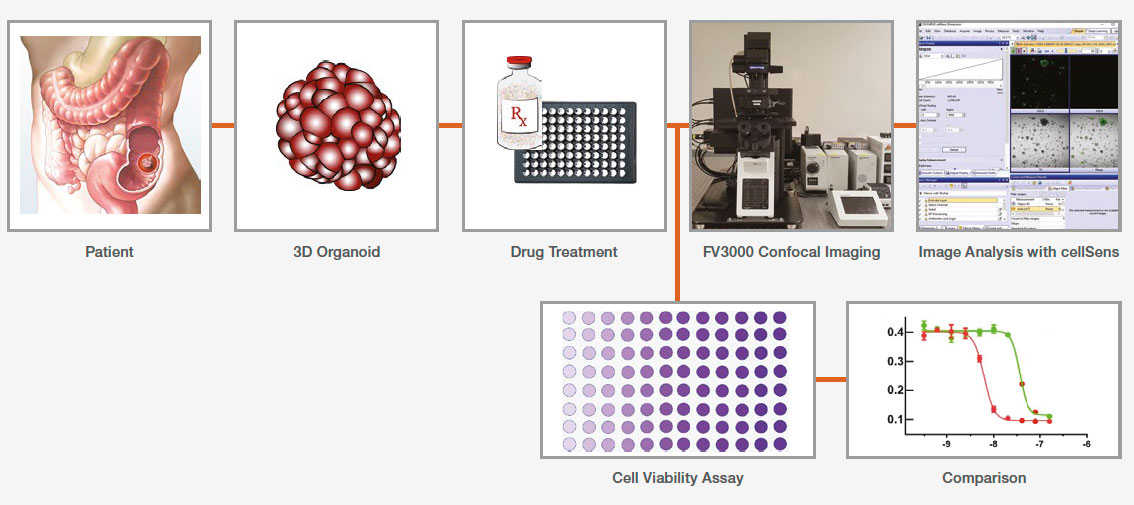
Application Workflow
Benefits
- Label-free organoid imaging
- Automated image processing, segmentation, measurement, and data export
- Batch analysis to expedite the drug screening process
Methods
Organoid culture
Colon cancer patient-derived organoids were grown in a Costar 96-well plate. Some wells were treated with staurosporine (ST) to compare organoids’ responses to the treatments.
Imaging
Organoid imaging was performed in the transmission detector of the Olympus FV3000 confocal laser scanning microscope. A far-red laser (640 nm) and a 4x objective were used to generate transmitted channel images. The image was acquired with a Z-stack because the organoids are located at various Z-positions. The step size was 5 μm.
Image Analysis Using the cellSens Macro Function
Performing image analysis with the cellSens macro function only requires two steps: recording the macro and running batch analysis.
1. Record the macro
In the Macro Manager, multiple steps can be recorded as a set of commands. In this analysis, we recorded the following commands:
- Select Channel: The transmitted channel was selected to analyze the brightfield images.
- Sobel: Sobel filter was applied as an ‘edge detection filter’.
- EFI Processing: Extended focus image (EFI) processing was applied to make a 2D projection.
- Segment: Automatic threshold was applied to segment organoids. The fill holes option was used to fill the empty area of the detected organoids.
- Median: The median filter was applied to smooth the edge of the object mask and remove small noises.
- Count and Measure: Organoid number and morphological features were measured. A size filter can be applied to select certain organoid populations.
- Export to Workbook: The measurements were exported to a spreadsheet.
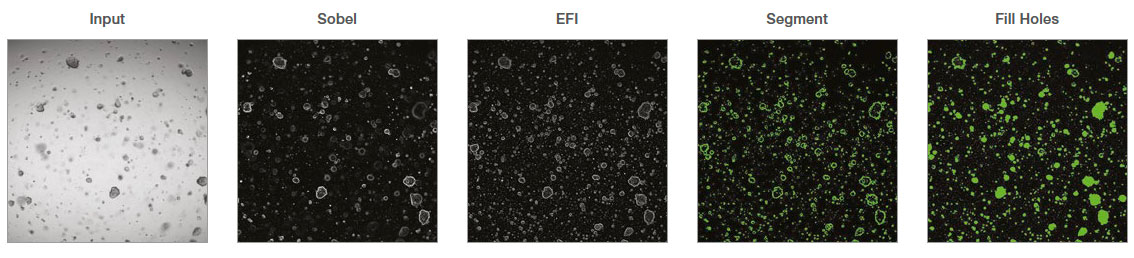
Figure 1: cellSens image analysis steps recorded as a macro process
2. Run batch analysis
Using the batch run mode in the macro function, we ran the recorded macro on multiple images in a specified folder. The analysis result was exported automatically as a spreadsheet.
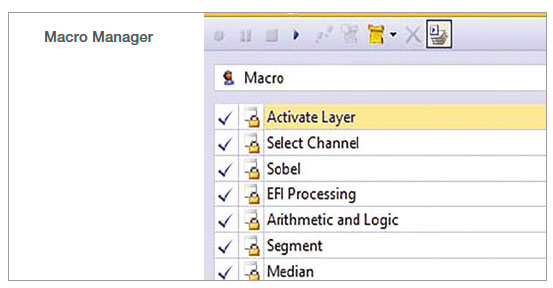
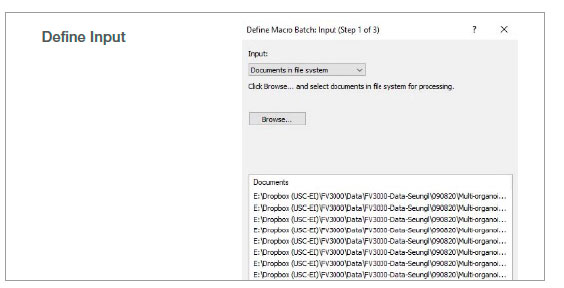
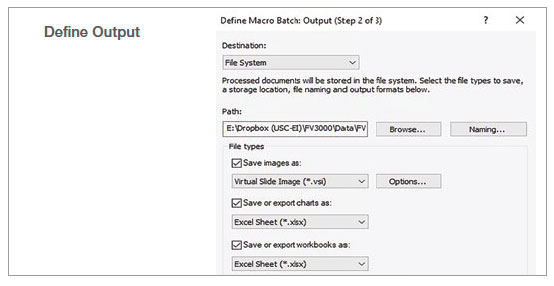
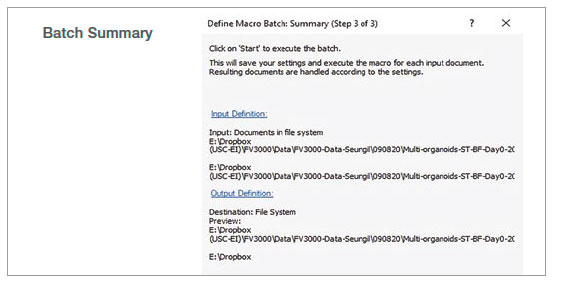
Figure 2: Batch analysis steps using a recorded macro process
CellTiter-Glo 3D viability assay
Separate 96-well organoid plates were prepared for each measurement day. A CellTiter-Glo 3D reagent was added to each well, and the cell viability signal (ATP level) was measured using a multiwell plate reader.
Results
Organoid size
Organoid size-related parameters (area, perimeter, and radius) increased over time in the untreated organoid culture. 0.1 μM ST treatment induced cell and organoid death. Organoid growth was completely inhibited, and there was no significant organoid size increase in the ST-treated organoids.
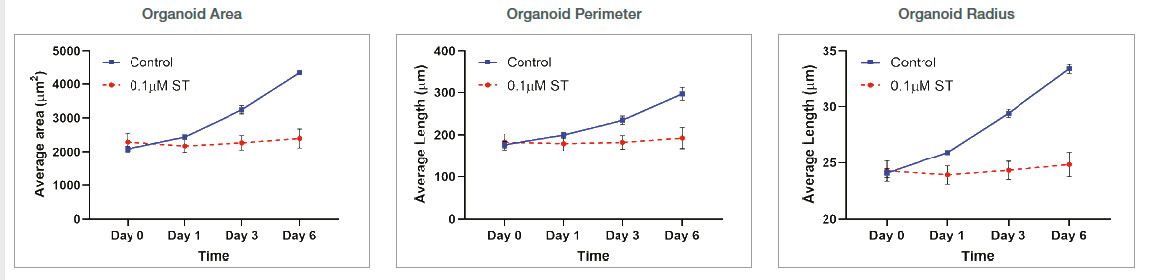
Figure 3: Control: n=370 0.1 μM ST: n=234. Changes of organoid size-related parameters over time with untreated and 0.1 μM ST-treated organoids.
Organoid morphology
Organoid morphology-related parameters (shape factor and sphericity) were measured. The shape factor value was higher in the ST-treated organoids, suggesting that those organoids have a rounder shape. Lower shape factor values in the untreated organoids suggest that these organoids have a more asymmetric and branched shape. There was no significant change in the sphericity value between untreated and ST-treated organoids.
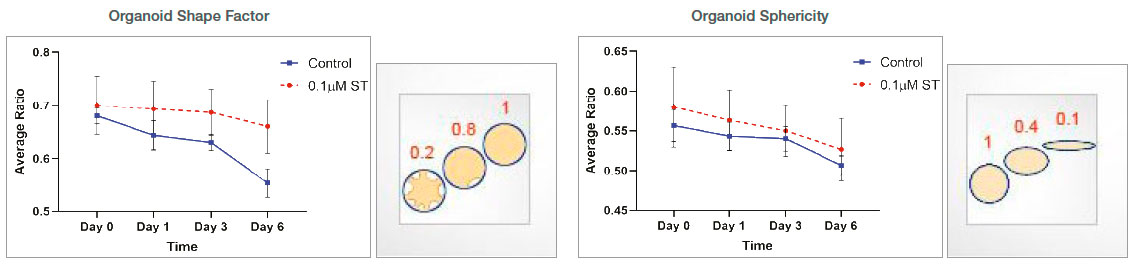
Figure 4: Measurements of organoid morphology-related parameters over time
Comparison to a cell viability assay
Organoid growth was measured using both the CellTiter-Glo 3D and imaging method. Organoid growth difference was shown earlier in the cellSens analysis (area). Variations of each data point were smaller in the cellSens quantifications because the imaging method uses the same plate over time. Cell viability measurement is an endpoint assay and uses multiple plates at each time point, increasing the variability.
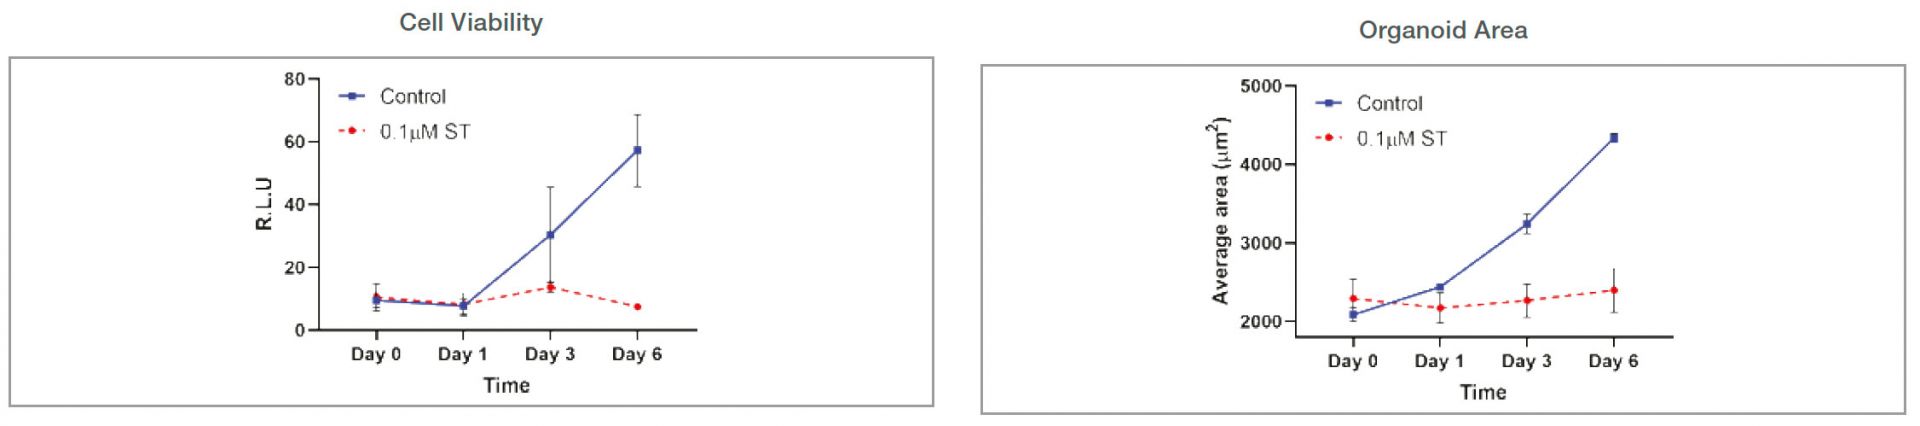
Figure 5: Comparison of cell viability assay and imaging-based cellSens analysis
Conclusion
With cellSens software’s macro function, we could establish a fast imaging and 2D batch image analysis process with label-free data. The accuracy and sensitivity of object detection and measurement in cellSens software were higher than in the CellTiter-Glo 3D cell viability assay. Furthermore, cellSens can perform multi-parametric analyses made possible using imaging data versus the single parameter readout from CellTiter-Glo. Also, we confirmed that the analysis can be easily performed through a few mouse clicks without knowledge of the macro programming language.
Authors
Seungil Kim, Brandon Choi, Lawrence J. Ellison Institute for Transformative Medicine, University of Southern California, Los Angeles, CA
Shohei Imamura, Olympus America
Produtos usados nesta aplicação
Sorry, this page is not
available in your country.