How the CM20 Improves the Cell Culture Process with Quantitative Data
Introduction
Cell cultures are the starting point for many types of life science and clinical research. However, the current cell culture process is inefficient and relies heavily on the experience and technique of skilled researchers.
In the current process, researchers remove cells from the incubator and observe them under a microscope to assess their condition. Since this process is done by hand, the results vary depending on the skill and experience of the researcher. In some labs, each researcher cultivates multiple cell lines, making it difficult to maintain the cell quality necessary for experiments. To obtain quantitative data, such as the number of cells, samples had to be peeled and disposed of after each measurement. And the result of this time-consuming process is often fragmentary data. To help solve these challenges, Olympus created the CM20 incubation monitoring system.
Cell Culture Measurement with the CM20 Monitoring System
The CM20 incubation monitoring system provides nondestructive measurement data while the cell cultures remain inside the incubator. The scanner’s advanced technology provides consistent, reproducible measurements to reduce labor and the variations common when different researchers are making their own measurements (Figure 1).
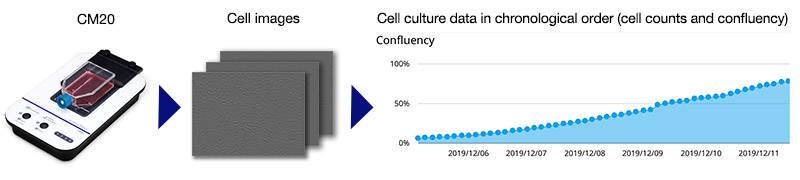
Figure 1. Continuous measurement
Acquire Images Continuously
The system is easy to use. To start, place your culture vessel on the CM20 monitor and set the observation time and position; the system will then begin acquiring images (Figure 2). This eliminates the need for researchers to set up a schedule to observe the cultures and record the observation position by hand. Also, because the system monitors changes in your culture over time and at the same positions, you can confirm the cells’ behavior and growth processes (Figure 3).
| Current | CM20 | |
|---|---|---|
| Observation time | Depends on the researcher’s schedule | 3-24 H intervals |
| Observation position | Depends on the skill and experience of the researcher | Fixed points: 25 points (T75 flask) |
Figure 2. Comparing cell measurement
|
|
|
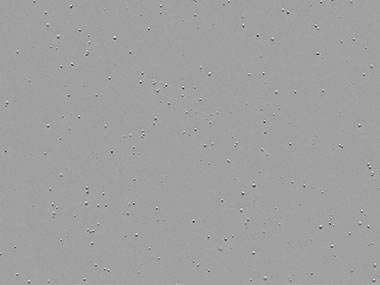
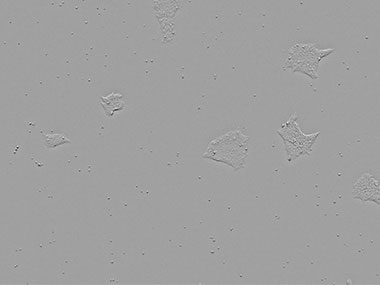
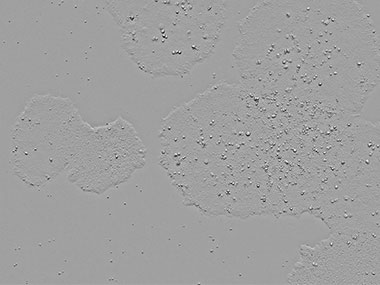
Figure 3. Observing changes over time in the same position
Quantitative Data with Less Effort
Using image processing and machine learning technology, the CM20 monitoring system can count cells and perform confluency analysis using images and then create quantitative data with simple parameter settings. For example, if the parameters set by experienced researchers are shared in the lab, the same analysis will be performed on the acquired images for consistent results.
Cell Counting
The number of cells is calculated by identifying the cell nucleus using an algorithm that recognizes the peak brightness. It can be adjusted by changing the cell size and contrast parameters (Figure 4).
|
|
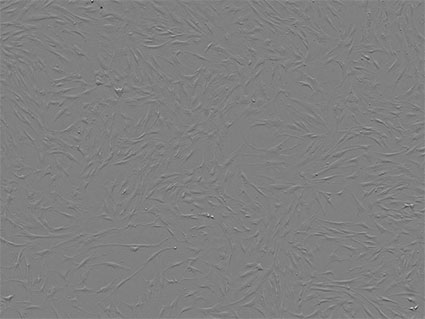
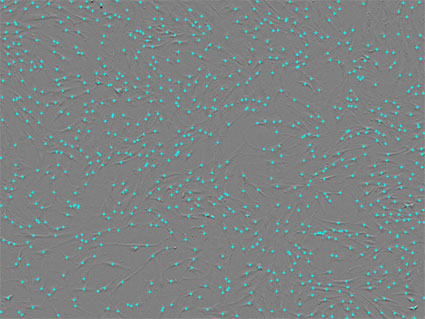
Figure 4. Cell counting; the cell nuclei are marked with blue
Confluency Analysis
The cell confluency is calculated by an algorithm that uses the characteristics of changes in brightness between the cell portion and background portion of the image. As a parameter, the cell part and background can be adjusted by marking the images and then using machine learning (Figure 5).
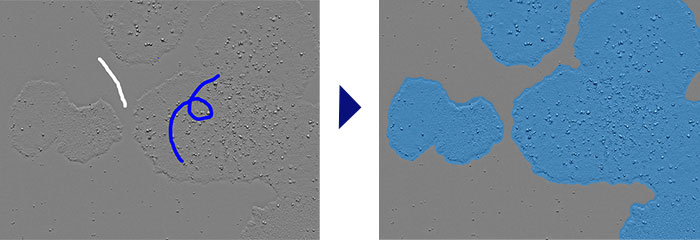
Figure 5. Confluency analysis (left: marked image for machine learning, right: the result of confluency analysis
Comparison of cell Growth with Different iPS Cell Lines
To test the results derived from the CM20 system and a researcher monitoring cell cultures by hand, we worked with iPS Portal, Inc. to acquire data on two cell lines.
Cells:iPS cells(1231A3、201B7)
Period:1 week
Vessel:6 well plate
Researcher:1 person
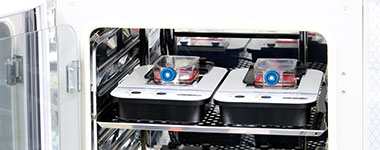
Figure 6. With one cell line per vessel, two CM20 monitors were placed in the incubator with the culture vessels
Based on the researcher’s experience, the cell line 1231A3 multiplied more readily than 201B7. However, since the conventional data acquisition is complicated, the difference in their proliferative capacity was not clear. To assess, we acquired images and confluency data for each cell line using the CM20 incubation monitoring system.
Figure 7: The qualitative information in the images shows that the cell confluency differs between the two cell lines on the same culture day.
Figure 8: From the quantitative information on cell density, especially after day 5, it is clear that the proliferation ability of 1231A3 was 3% to 6% higher compared to 201B7.
Figure 7-1. Image of day 7 (1231A3) |
Figure 7-2. Image of day 7 (201B7) |
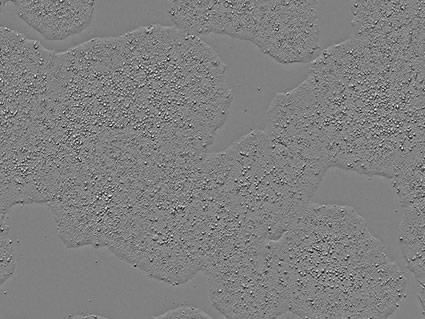
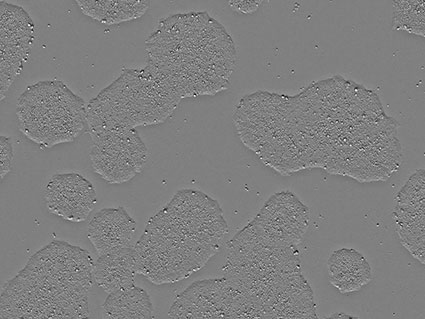
Figure 8-1. The confluency of each cell line |
Figure 8-2. The confluency difference between two cell lines |
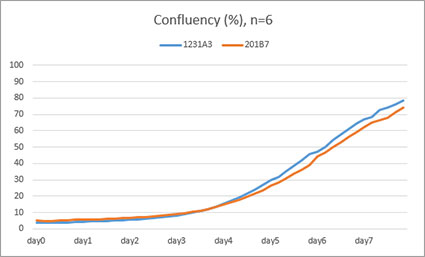
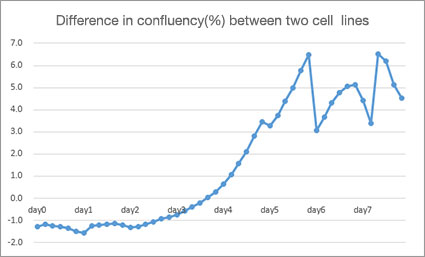
Based on the above data, the difference in the growth rate between the two cell lines, which the researcher recognized through their intuition and experience, was clarified by the quantitative data using the CM20 system. This demonstrates an important value of the CM20 incubation monitoring system—even if the researcher in charge changes, there will be little variation in cell confluency data because all the cultures are checked using the CM20 system. And if there is an abnormal value, it is easy to look back and investigate the cause. In addition, by acquiring these data for each cell line, it enables you to understand the characteristics of the cell cultures, making it possible to perform experiment transitions at the appropriate time.
Conclusion
Using the CM20 incubation monitoring system, users can easily and intuitively acquire daily cell culture data (cell images, cell counts, and cell confluency). These data enable users to better understand the factors that cause variations in cell culture and eliminate them, which contributes to improved cell quality and the reproducibility of cell experiments.
Author
Shogo Usui
SSPD Electrical Engineering
Olympus Corporation
Sorry, this page is not
available in your country.