True 3D Analysis of an Intracellular Autophagic Pathway in a 3D Spheroid Model
Summary
3D culture models have been used for predicting drug efficacy or toxicity. In this application note, we focus on an intracellular autophagic pathway. First, we confirmed the usefulness of the EGFP-LC3 probe for monitoring the models’ autophagic status. Then, Olympus’ true 3D analysis workflow using the FLUOVIEW™ FV3000 confocal microscope and NoviSight™ software was used to quantitatively evaluate the effect of a drug candidate called chloroquine. We demonstrated that this analysis workflow offers an alternative to profiling drug candidates using in vivo studies.
Introduction
Intracellular molecular events are closely related to a wide variety of pathologies in humans. Autophagy is an intracellular process that degrades and recycles cellular organelles and proteins, and the dysregulation of autophagy is implicated in human diseases. To better understand these disease processes and test the efficacy of drugs on them, it is important to monitor the autophagic status of human cells under pathological and therapeutic conditions.
3D culture models such as spheroids or organoids closely resemble the complex in vivo microenvironment. To evaluate the efficacy of a drug on the cells in the spheroid, it is critical to quantitatively analyze intracellular microscopic images. In this application note, we assessed a dynamic intramolecular autophagy process and quantitatively evaluated the effect of a drug candidate using the Olympus FV3000 confocal microscope and NoviSight analysis software’s true 3D analysis workflow.
Benefits
- Quantitative analysis of intramolecular events in 3D culture models
Results and Discussion
An LC3 protein is a useful marker in an autophagy process. For example, it has been reported that EGFP-LC3 fluorescence dots increased when autophagosomes were accumulated. Autophagosome formation is regulated by various compounds that modulate the autophagic activities or the turnover of autophagosomes. Some of these compounds are now in clinical trials. One, chloroquine (CQ), originally an anti-malarial drug, is now in a clinical trial for cancer treatment because it inhibits the fusion of autophagosomes and lysosomes.
Validation of an autophagy marker using a 2D culture system
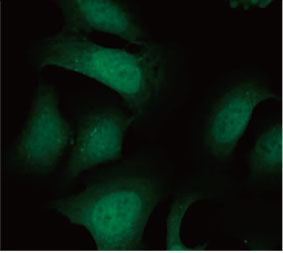
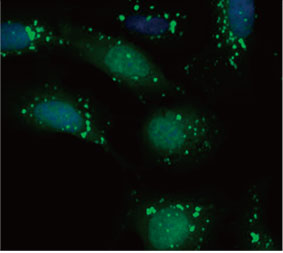
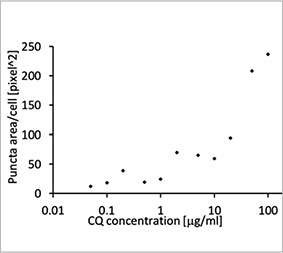
We validated the usefulness of an EGFP-LC3 probe to measure the CQ’s inhibitory effect on the autophagic process in a 2D culture system. We prepared a U2OS osteosarcoma cell line stably expressing EGFP-LC3. The cells were cultured as monolayers in microplate wells. After adding CQ, the cells were fixed and stained with Hoechst 33342. Fluorescence images showed that CQ treatment evoked the formation of EGFP-LC3 puncta (Figure 1 A and B). The puncta area per cell was measured based on the position of each cell’s nucleus. The puncta area increased as the concentration of CQ increased, confirming the usefulness of the EGFP-LC3 probe to measure an autophagic process.
(A)
| (B)
| (C)
|
Figure 1 A and 1 B: (A) EGFP-LC3-expressing U2OS cells cultured in normal condition. (B) EGFP-LC3-expressing U2OS cells treated with CQ for one hour. Figure 1 C: The increase of the puncta area per cell plotted with the increase of CQ concentration. | ||
Quantification of LC3 punctate in the cancer spheroid model
To monitor autophagic status in 3D culture models, we selected a HeLa cell line established from cervical carcinoma. The HeLa cells are suited for a scaffold-free 3D culture protocol and form cancer spheroids of uniform size. We prepared a HeLa cell line stably expressing EGFP-LC3.
The cells were seeded in round-bottom, low-attachment microplates. After five days’ culture, the spheroids were treated with CQ for seven hours. Then, the spheroids were fixed, membrane-permeabilized, their nuclei stained, and finally cleared with SCALEVIEW-S4 (FUJIFILM WAKO).
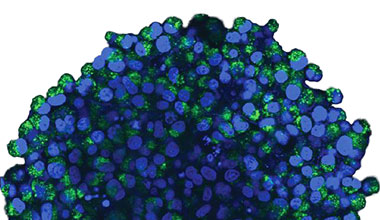
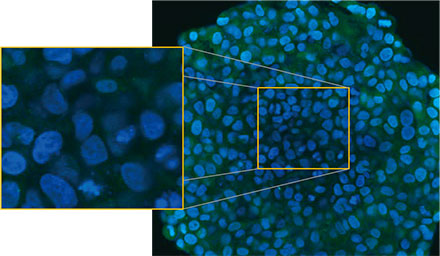
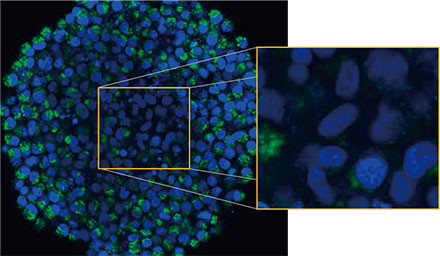
We observed the spheroids using Olympus’ FLUOVIEW™ FV3000 confocal system. We used a silicone immersion objective (UPLSAPO30XSIR) because of its high numerical aperture (NA) and reduced spherical aberration. Figure 2 (A)* shows a single Z-slice image of the non-treated spheroid at the equator. The EGFP signal appeared uniformly in the cells. In contrast, CQ treatment induced the formation of puncta EGFP signals in the cells (Figure 2 (B)*). The puncta formations were observed both in the peripheral zone and in the central zone of the spheroid. CQ treatment did not cause any apparent change of the spheroid’s size, indicating that the intracellular autophagic process might be a better marker for evaluating the efficacy of CQ in 3D cancer spheroids.
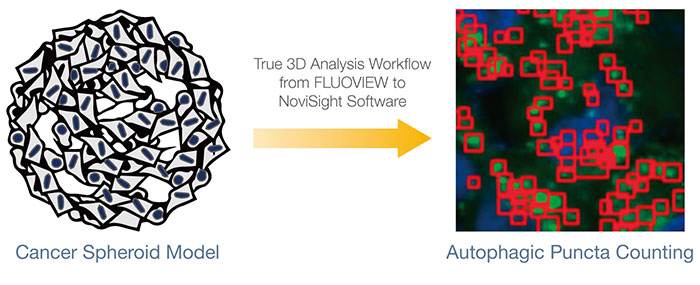
To quantitatively analyze the intracellular events in the 3D culture models, we used Olympus’ true 3D analysis workflow that combines images captured using the FV3000 confocal microscope and analysis using NoviSight™ software, which offers many benefits over conventional analytical methods. In a conventional analysis, we would use the integrated characteristic value of the recognized objects from multiple Z-slice images or analyze the projection image of multiple Z-slice images. These methods are unreliable because they can lead to counting objects of interest multiple times or missing objects of interest that were overlapped and obscured by other objects. In contrast, the Olympus true 3D analysis workflow includes the acquisition of sequential Z-slice images with Z-intervals optimized by the FLUOVIEW™ software. The software reconstructed the 3D volume and recognized the objects of interest as clusters of voxels. NoviSight software is then used for statistical analysis. The workflow from FLUOVIEW to NoviSight software is straightforward and offers an ideal platform for the analysis of 3D culture models.
(A)
| (B)
|
Figure 2 A and 2 B: EGFP-LC3-expressing HeLa cell spheroids (A) in normal condition and (B) treated with CQ. The enlarged images show the yellow rectangle region of the original spheroid images.* | |
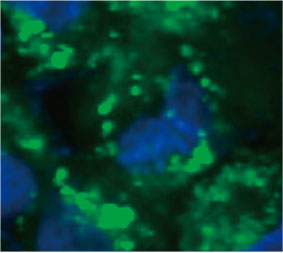
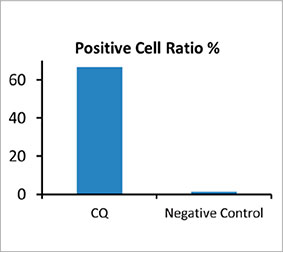
To calculate the number of autophagy-positive cells in the spheroid, the software identified the nucleus of each cell. Next, the regions surrounding each nucleus were defined as mask regions. Finally, the puncta of EGFP signals in the mask regions were recognized as puncta objects (Figure 2 (C)*). Cells that have more than three puncta were regarded as autophagy-positive cells. The 3D spheroid without drug treatment had about 1.4% autophagy-positive cells, while the spheroid treated with CQ showed 66.6% autophagy-positive cells (Figure 2 (D)*). Quantitative analysis also supports that CQ induced the puncta to form in the cancer spheroids.
(C)
|
| (D)
|
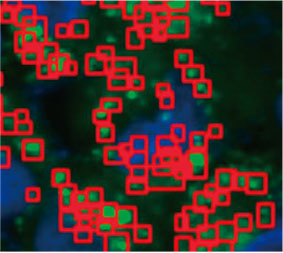
Figure 2 C Left: The original image of the cells in the spheroid with CQ. Right: The same image with object recognition for puncta (red rectangles).* | ||
Conclusion
The Olympus FLUOVIEW FV3000 confocal microscope and NoviSight software, as part of a true 3D analysis workflow, were used to quantitatively evaluate the effect of CQ on the intracellular autophagy process in 3D culture models. This study demonstrates that researchers can use this workflow to profile drug efficacy in a dose-dependent manner or screen multiple drug candidates objectively. There are other intracellular molecular markers that are relevant to drug efficacy or drug toxicity, such as FISH signals on chromosomes or translocation of fluorescent-labeled signaling molecules. This workflow can help to quantitatively evaluate a wide range of intracellular events in 3D culture models and offers alternative profiling of drug candidates in lieu of in vivo studies.
References
- Maria C et al., (2019) Targeting autophagy to overcome human disease. International Journal of Molecular Sciences. 20(3): E725. doi: 10.3390/ijms20030725
- Yan C et al., (2013) Therapeutic targeting of autophagy in disease: Biology and Pharmacology. Pharmacological Reviews. 65: 1162–1197. doi: 10.1124/pr.112.007120
- Daniel JK et al., (2008) Guidelines for the use and interpretation of assays for monitoring autophagy in higher eukaryotes. Autophagy. 4(2): 151–175. doi: 10.4161/auto.5338
Author
Kazuhito Goda
*Although it became one of the most important cell lines in medical research, it’s imperative that we recognize Henrietta Lacks’ contribution to science happened without her consent. This injustice, while leading to key discoveries in immunology, infectious disease, and cancer, also raised important conversations about privacy, ethics, and consent in medicine.
To learn more about the life of Henrietta Lacks and her contribution to modern medicine, click here.
http://henriettalacksfoundation.org/
Products related to this application
Sorry, this page is not
available in your country.