Photomicrography under fluorescence illumination conditions presents a unique set of circumstances posing special problems for the microscopist. Exposure times are often exceedingly long (in some instances running from many seconds into several minutes), the specimen's fluorescence may fade during exposure, and totally black backgrounds often inadvertently signal light meters to suggest overexposure.
In addition, fluorescing specimens emit their own light, and particles residing above and below the desired plane of focus often radiate light causing blurring of the image details. Even though fluorescence images may appear to be bright when viewed through the microscope eyepieces (due to the human eye's exquisite sensitivity to light), they usually require lengthy exposure times in order to register a satisfactory image on film. Very long exposures complicate photomicrography of specimens stained with fluorescent dyes by increasing the likelihood of vibration and film reciprocity failure effects causing undesirable color shifts in the image.
While the basic problem with fluorescence photomicrography is often the paucity of light reaching the film, there are a number of steps that can be taken to improve image quality. Microscope objectives utilized for fluorescence should have as high a numerical aperture as possible, with high transmission values for the wavelengths of light being employed in the experiments. Because the light intensity (in reflected light fluorescence) varies as the fourth power of the numerical aperture, these objectives can significantly reduce exposure times in reflected light fluorescence microscopy. Light intensity also varies inversely as the square of the magnification, resulting in brighter images when the total magnification on film is held to a minimum. Reduction of magnification on the film plane is often assisted by the use of low magnification photoeyepieces (or projection lenses). In addition, when using a trinocular head, it is usually desirable to divert all light to the camera rather than have the light split (by means of a beamsplitter) between the viewing eyepieces and the camera. Because the image intensity also varies inversely as the square of the distance to the film plane, microscopes perform better then this distance is kept short. For this reason, and due to widespread availability, most fluorescence microscopy is recorded on 35 millimeter film (as opposed to larger format) when using traditional photomicrography to capture images. Modern low-noise temperature-controlled CCD digital cameras are being increasingly used to replace film as the medium of choice for fluorescence photomicrography.
Low light levels and the fading of fluorescent specimens are two of the primary difficulties to overcome in fluorescence photomicrography. Often, the dynamic nature of fluorescent preparations makes good photomicrography essential to capture a record of events occurring with the specimen, and often may reveal details not obvious when examining the specimen through the eyepieces. Long exposures, so commonly used in fluorescence, inevitably lead to reciprocity failure and fading of specimen fluorescence intensity during prolonged irradiation. In fact, fading of specific fluorescent features is often faster than that of the background, leading to a loss of image contrast.
All photographic emulsions (including black & white, color negative, and color transparency films) suffer from an effect known as reciprocity law failure when exposed to light for exceeding long or short time periods. The reciprocity law relates image density to exposure time and light intensity, such that there is a reciprocal relationship between illumination intensity in the microscope and the required exposure time for film. In effect, the law states that exposure time is inversely proportional to light intensity in order to maintain a constant film density. The lower the light intensity, the longer the necessary exposure time required to produce a satisfactory image. This inverse relationship holds true for most films if the proper exposure duration is between 1/500 of a second and 1/2 second.
In fluorescence microscopy, low light levels routinely demand exposures that exceed 1/2 second (often ranging from several seconds to several minutes). The reciprocity relationship no longer holds under these conditions, and the film will require additional exposure time to yield the proper image density. This phenomenon is called reciprocity failure, a term that only indicates that the linear relationship between exposure time and light intensity no longer holds and does not suggest a failure of the film emulsion in terms of performance.
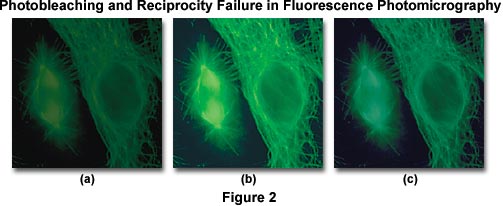
A side effect of reciprocity law failure is that the already weak specimen fluorescence is further reduced by photobleaching of the specimen, and incorrect color reproduction often occurs due to increased exposure times. The series of images presented in Figure 2 are fluorescence photomicrographs illustrating antibody fluorochrome labeling with the popular reagent fluorescein-5-isothiocyanate (FITC) when imaged using an Olympus WIB long-pass fluorescence cube. The cells in the center (Figure 2(b)) were photographed using a corrected exposure time adjusted for reciprocity law failure and Kodak Wratten color compensating filters to remove an undesirable color shift. On the left (Figure 2(a)), the same viewfield shows the effect of photobleaching, or fading of the fluorescence activity due to prolonged exposure to the illumination source. Color shifts and reduced image intensity resulting from reciprocity law failure are evident in Figure 2(c).
Fluorescence Filter Spectra
Explore the overlap of fluorescence filter spectra and how changes in these filters determines the bandwidth of wavelengths passed through the various filter combinations.
Reciprocity failure can often be compensated simply by an increase in exposure time or processing conditions for black & white films, but this is not always the case with color negative and transparency films. Most color films have three color-sensitive dye layers, each of which has a slightly different characteristic curve position and slope resulting in varied responses to the reciprocity effect with the potential to cause undesirable color shifts or casts. Often, both exposure times and color balance filters must be adjusted to compensate for very long or short exposures when using color films.
Utilization of an objective having a very small numerical aperture (for instance, a 40x objective with NA = 0.65 as opposed to the same magnification objective having a NA of 0.85, 0.95, or 1.0) produces an image displaying insufficient brightness, which results in longer exposure times. The numerical aperture is a measure of the objective's light gathering ability, meaning that high numerical aperture objectives can capture a greater amount of the weak fluorescence emission produced by chromophores. Always use the highest available objective numerical aperture when doing fluorescence photomicrography. Using excessive objective and photoeyepiece magnifications will also result in reduced brightness. To compensate for this, always employ the lowest possible magnification photoeyepieces and the highest numerical aperture objectives at a given magnification. For example, a 60x plan apochromat objective having a numerical aperture of 0.95 (brightness index = 22.6) is preferable to a 60x plan fluorite objective of numerical aperture equal to 0.85 (brightness index = 14.5) even though the working distance of the fluorite objective is twice that of the apochromat. Furthermore, since high numerical aperture objectives have a shallower depth of field, their use may avoid contrast-reducing effects of out-of-focus emission from above or below the plane of focus. Likewise, a 2.5x photoeyepiece will provide more illumination than a 3.3x or 5x eyepiece. Laser scanning confocal microscopes are specifically designed to virtually eliminate out-of-focus light and give much clearer fluorescence pictures with somewhat better resolution.
Objective Brightness Values
| Objective Magnification | Numerical Aperture (NA) | Objective Brightness Index |
|---|---|---|
| 10 | 0.25 | 3.9 |
| 10 | 0.30 | 8.1 |
| 10 | 0.45 | 41.0 |
| 10 | 0.50 | 62.5 |
| 20 | 0.40 | 6.4 |
| 20 | 0.50 | 15.6 |
| 20 | 0.75 | 79.1 |
| 40 | 0.65 | 11.1 |
| 40 | 0.75 | 19.8 |
| 40 | 0.95 | 50.9 |
| 40 | 1.00 | 62.5 |
| 40 | 1.30 | 178.5 |
| 60 | 0.85 | 14.5 |
| 60 | 0.95 | 22.6 |
| 60 | 1.40 | 106.7 |
| 100 | 1.25 | 24.4 |
| 100 | 1.40 | 38.4 |
Table 1
Typical fluorescence applications in fields such as cell biology and medical diagnostics are not only concerned with specimen brightness, but also the ratio of specific specimen fluorescence to the intrinsic background fluorescence. This is particularly important for single-molecule fluorescence events and other low light experiments where autofluorescence and/or internal reflection inside the objective produces vast differences in the ability to image small structures with low fluorescence quantum yields. To maximize the signal-to-noise ratio (intensity of the specimen fluorescence above the background) in objectives designed for fluorescence microscopy, manufacturers use quartz and other special glass formulations that have high transmission values throughout the spectrum from infrared to the ultraviolet. These objectives are extremely low in autofluorescence and utilize special optical cements and anti-reflection coatings designed to operate through an extended range of fluorescence excitation wavelengths. Higher numerical apertures coupled to advanced glass formulations provide modern fluorescence objectives with the ability to excite specimens at wavelengths down to 340 nanometers with much higher transmission values in order to obtain a brighter fluorescence image.
A comparison of nominal objective brightness values for common magnifications and numerical apertures is presented in Table 1. These numbers were calculated according to the following equation:
where NA is the objective numerical aperture and the Transmission Ratio is presumed to be 100,000. From this equation, it is apparent that for the same magnification, image brightness of both the illumination field and secondary fluorescence increases with the numerical aperture of the objective, but also decreases with increasing magnification. The actual numerical aperture and magnification values for a particular objective may vary by as much as 5-10 percent from the nominal values. Brightness transmitted by an objective, as discussed above, is also dependent upon the internal construction parameters, such as the number of glass lens elements, internal reflections and glare, and lens coatings. Often, it is necessary to sacrifice higher optical correction of chromatic aberration found in apochromat objectives for the enhanced image brightness displayed by higher numerical aperture fluorite objectives with lesser correction.
Use as high a numerical aperture condenser as possible with transmitted light fluorescence to avoid light loss and the accompanying long exposure times. Also when using a substage mirror on older microscopes, purchase a mirror that has an aluminized surface instead of a silvered mirror (silver will reflect ultraviolet light poorly). Often, an oil immersion darkfield condenser may be substituted for standard brightfield condensers for transmitted fluorescence applications. When using immersion oil, apply a non-fluorescent oil between the top lens of the condenser and underside of the microscope slide and between the objective front lens and the coverslip. Oils of this type are readily available from a number of commercial manufacturers.
Photobleaching, or dye photolysis, rapidly degrades fluorescent probes used to stain specimens and should be minimized by exposing the preparation to the lowest illumination levels as is possible. This effect is caused primarily by the photodynamic interaction between the fluorochrome and oxygen, which involves promoting the dye molecule from the singlet ground state to the relatively long-lived triplet excited state by a process termed intersystem crossing. Once the chromophore has been elevated to an excited state, it becomes more chemically reactive and may then participate in irreversible chemical reactions including decomposition, polymerization, oxidation (primarily by singlet oxygen) or reaction with another molecule. Reaction with oxygen will usually cause bleaching of the chromophore, depending upon the intracellular singlet oxygen concentration and the proximity of the chromophore to other internal cellular components such as proteins, lipids, or small molecules. Calculations indicate that singlet oxygen can produce chromophore photolysis over a distance exceeding 500 angstroms.
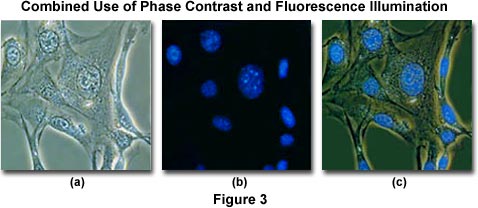
To minimize the effects of photobleaching, fluorescence microscopy can be combined with other techniques that are non-destructive to the fluorochromes, such as differential interference contrast (DIC), Hoffman modulation contrast (HMC), transmitted darkfield illumination, and phase contrast. The idea is to locate the specific area of interest in a specimen using the non-destructive contrast enhancing technique then, without relocating the specimen, switch the microscope to fluorescence mode. The results of a typical experiment of this type are illustrated in Figures 3 and 4. Figure 3(a) illustrates 3T3 fibroblasts in monolayer tissue culture imaged using phase contrast optics. The cell line was established from a National Institutes of Health line of Swiss mouse embryo cells, which are highly contact inhibited and useful for studies involving sarcoma virus formation and leukemia virus propagation. The photomicrograph in Figure 3(b) shows the same viewfield, but this time imaged using fluorescence illumination (a mercury vapor lamp and an Olympus WU filter cube) with cells stained by the fluorochrome 4',6-diamidino-2-phenylindole (DAPI), a nucleic acid specific dye with an emission maximum at 461 nanometers, which is used to selectively stain nuclei and chromatin. Figure 3(c) illustrates the two techniques used in combination to produce a beautiful photomicrograph of fluorescent-stained 3T3 cellular nuclei superimposed on a phase contrast image of the fibroblast cell membranes and internal organelles. This image was recorded with a specialized fluorite objective designed with phase rings to permit simultaneous observation of both fluorescence and phase contrast with the same objective.
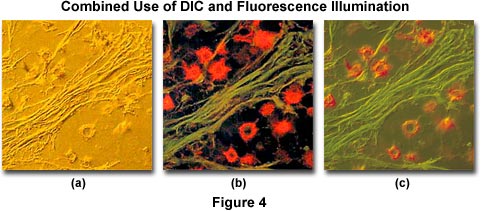
Another example of combined techniques, this time using differential interference contrast (DIC), is presented in Figure 4. Illustrated in Figure 4(a) is a thin section of cat brain tissue infected with cryptococcus and imaged using DIC optics and a full-wave retardation plate. Note the pseudo three-dimensional appearance of the photomicrograph. Figure 4(b) shows the same viewfield, but imaged with fluorescence illumination and an Olympus WIB filter cube. The cells in Figure 4(b) were stained with a combination of fluorescein-5-isothiocyanate (FITC) and Congo red (emission wavelength maxima of 520 and 614 nanometers, respectively). The two techniques are used in combination to produce Figure 4(c), which illustrates the infected cat brain tissue in both fluorescence and DIC illumination.
Fluorescence Combination Techniques
Explore how contrast enhancing techniques can be coupled to fluorescence microscopy to locate specific areas on the specimen for further analysis.
The rate of photobleaching is dependent upon several factors, including the chemical reactivity of the chromophore, the intracellular chemical environment, and the intensity and wavelength of the excitation light. Some fluorescent dyes are readily susceptible to photobleaching while others are relatively insensitive and are stable for much longer periods. In many instances, the specimen may recover from the effects of photobleaching, particularly if it is kept cool and in a dark environment. Photobleaching should be distinguished from another fluorescence artifact termed quenching, which occurs by reduction (or in some cases, enhancement) of fluorescence intensity by competing processes such as temperature, high oxygen concentrations, and molecular aggregation in the presence of salts or halogen compounds. Sometimes quenching results from the transfer of energy to other acceptor molecules residing physically close to the excited fluorochromes, a phenomenon known as resonance energy transfer. This particular phenomenon has become the basis for a newer technique of measuring distances far below the lateral resolution of the light microscope. Impurities in the chromophore may also reduce fluorescence intensity either by photobleaching or quenching.
Photobleaching can be minimized by reducing exposure times (as discussed above) or by lowering the excitation energy (lamp intensity), however these remedies are accompanied by the undesirable effect of reducing the chromophore fluorescence emission energy. Neutral density filters can be placed in the light path before the light reaches the excitation filter, thus diminishing the excitation light intensity and reducing fading effects during specimen observation. Many fluorescence microscopes are equipped with a shutter system coupled to neutral density filters that allow excitation light to be reduced in intensity during observation and specimen manipulation, but enable the microscopist to easily switch to full-power illumination for photomicrography. It is also helpful, where possible, to deoxygenate specimens (but not living cells or tissues) and to use specific antifade reagents such as n-propylgallate and other inhibitors, which are commercially available. Chemicals that are capable of quenching singlet oxygen can also be employed to reduce the effects of photobleaching. Examples are 2-mercaptoethylamine, 1,4-diazabicyclo-2,2,2-octane (DABCO), diphenylisobenzofuran, p-phenylenediamine, and the amino acid histidine. Fading effects can also be reduced, in some instances, by changing the pH concentration of the mounting medium.
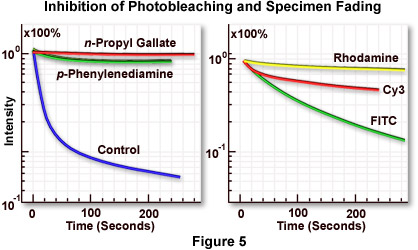
Figure 5(a) illustrates inhibition of the rate of fluorescence fading by several commercially available antifade reagents. The blue curve shows the rapid decline in fluorescence intensity with an untreated specimen, while the green and red curves demonstrate reduction of the fading rate by two antifade reagents of slightly differing efficiency. The specimen is marsupial kidney tissue culture cells (PtK2) stained with either fluorescein-5-isothiocyanate (FITC) or rhodamine phalloidin (both dyes have similar fading properties). Antifade reagents were p-phenylenediamine (green curve) or n-propyl gallate (red curve). Specimen secondary fluorescence fading rates usually differ depending upon the fluorochrome in use, even with observation under identical conditions. The best results can be obtained by selecting a fluorochrome with the lowest fading speed from those available for a particular application. This concept is illustrated in Figure 5(b), which compares the difference in marsupial kidney cell fading speed for three fluorochromes: rhodamine (yellow curve), the cyanine dye Cy3 (red curve), and FITC (green curve). Rhodamine, a ubiquitous dye with many applications, displays a very slow fading rate (Figure 5(b); yellow curve) under these conditions and is the best fluorochrome for photomicrography using this system.
To further minimize fading, it is advisable to conduct initial observations in one field within the specimen and then to quickly move to a "fresh" field just prior to taking the exposure. This practice may help to circumvent bleaching and/or fading effects. It is also helpful to do both observation and photomicrography in a partially darkened room environment. Although chemical methods and careful microscopy can reduce photobleaching, the most effective remedy is to increase detection sensitivity (coupled with reduced excitation energy) using a low-light level CCD digital camera designed specifically for fluorescence microscopy.
The occurrence of photobleaching has led to a technique known as FRAP, which is an acronym for Fluorescence Recovery After Photobleaching. This technique is based upon bleaching by short laser bursts and subsequent observation of the recovery of fluorescence caused by the diffusion of fluorochromes into the bleached area.
Barrier filters are designed to absorb specific wavelengths of excitation radiation that are reflected from, or transmitted by, the specimen and to transmit only the chosen visible light fluorescence. The cutoff wavelength range of the barrier filter is critical, because in many instances it must be able to transmit visible wavelengths that are not far in value from the excitation light used to illuminate the specimen. Because film is very sensitive to ultraviolet and visible wavelengths in the 380-450 nanometer region, it is particularly important that the barrier filter block all unwanted wavelengths in this range. To ensure removal of shorter wavelengths, additional ultraviolet blocking filters, such as the Kodak Wratten filter numbers 2A, 2B or 2E, should be added to the optical pathway. All of these filters completely absorb ultraviolet light, but have a slight difference in their absorption of lower wavelength visible blue light. Supplementary ultraviolet filters should be placed before the main barrier filter in the light path in order to block radiation that might induce autofluorescence in the main barrier filter, especially if this filter is yellow, orange, or red in color. If the barrier filter cuts the spectrum at too long a wavelength, specimen fluorescence color will be affected and the intensity of the image may be compromised, especially when only the long-wavelength portions of transmitted fluorescence are passed by the filter.
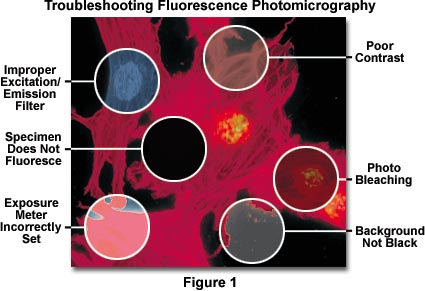
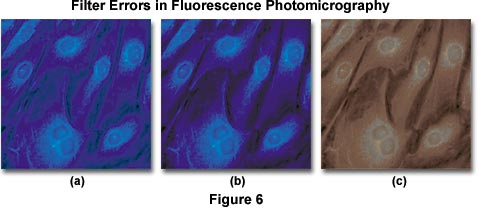
Color balance errors in fluorescence photomicrography may have a number of origins. The photomicrographs presented in Figure 6 illustrate several problems that arise with color degradation from autofluorescence and improper filtration when imaging specimens under fluorescence illumination. The specimen is a monolayer of fibroblast cells grown in tissue culture and stained with 7-amino-4-methylcoumarin-3-acetic acid (AMCA), a bright ultraviolet-excitable dye conjugate with an emission wavelength maximum of 445 nanometers (in the short-wavelength blue region). The optimal excitation wavelength of AMCA is 345 nanometers, which requires an excitation filter that passes a significant amount of ultraviolet light. Under proper conditions of illumination and filtration, the stained specimen appears with nuclei and cytoplasmic components stained a rich and deep blue color (imaged with an Olympus WU filter cube), as illustrated in Figure 6(b). When a barrier filter that passes too much ultraviolet light is used, a blue cast and background color are often present in photomicrographs of the specimen (shown in Figure 6(a)), and secondary fluorescence colors are degraded. Placing an auxiliary ultraviolet and/or short blue wavelength barrier filter somewhere in the microscope optical pathway is the method of choice for alleviating this problem.
Fluorochromes used to stain specimens often produce an undesirable amount of short wavelength blue autofluorescence, particularly when staining tissue sections. As mentioned above, this autofluorescence must be absorbed by the barrier filter to avoid degradation of secondary fluorescence emission produced by the fluorochrome-tagged specimen. Kodak Wratten filters 2A and 2E, which absorb short-wavelength blue radiation, are suitable for use in this application. The microscope manufacturers and aftermarket suppliers also offer filters useful in fine-tuning the cutoff range of barrier filters.
Intrinsic autofluorescence in mounting media can also cause the type of problems associated with the photomicrograph illustrated in Figure 6(a). Many of the popular permanent mounting media formulations exhibit autofluorescence as an undesirable side effect, and should not be used for quantitative fluorescence work. Instead, temporary mounts made with pure glycerin, glycerin-water mixtures, or fluorescence-free immersion oils should be utilized to prepare specimens. The microscope manufacturers offer specialized objectives that are optically corrected for specimen observation in glycerol. Autofluorescence produced by mounting media is usually pale blue or green in color and will lead to degradation of secondary fluorescence by the specimen. If the barrier filter does not remove superfluous autofluorescence generated by mounting media, sometimes Kodak Wratten color compensating filters can be added to the pathway to alleviate this problem. The pale blue color generated by most media can be removed by using a filter such as the CC20Y (yellow), and pale green fluorescence can be neutralized with a CC20M (magenta) filter. Use of higher density filters (CC30 and above) will often lead to absorption of secondary fluorescence.
Autofluorescence exhibited by cells and tissues in culture can often limit the ability to detect fluorescent probes in stained and fixed preparations. The extent of autofluorescence displayed by fixed tissues will often vary depending upon specimen preparation and the experimental conditions used to detect fluorescence. Flavin coenzymes (FAD and FMN) and reduced pyridine nucleotides (NADH) are the principal sources of autofluorescence in mammalian cells. Secondary fluorescence in fluorochrome-stained plant cells is often masked by autofluorescence from lignins (green autofluorescence) and porphyrins such as chlorophyll (red autofluorescence). This problem can sometimes be overcome with fixed cells and tissues by thorough washing with a 0.1 percent solution of sodium borohydride in phosphate-buffered saline for 30 minutes prior to staining.
When excitation and/or emission filters are not matched to the wavelength absorption and emission spectrum of chromophores used to stain specimens, then secondary fluorescence is usually compromised, as illustrated in Figure 6(c). In this example, an improper emission filter having too short of a wavelength cutoff is used to pass secondary fluorescence emitted by the specimen. Because a majority of this fluorescence is centered in the blue region of the spectrum (at 455 nanometers), only muddy reddish long wavelength color tones are passed by the filter. To correct the problem, a new barrier filter should be chosen. Overexposure of color film, along with reciprocity errors, can also cause dramatic color shifts of secondary fluorescence in final images.
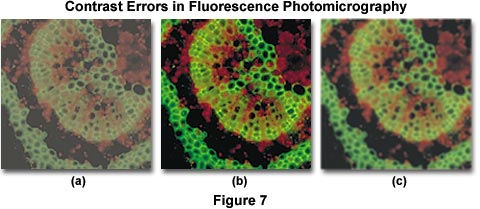
Contrast errors often arise in fluorescence microscopy when the microscope optical train is mis-configured or the wrong filter combinations are utilized. Several of these errors are presented in Figure 7, which illustrates poor contrast in secondary fluorescence images caused by improper excitation filter choice and fluorescent immersion oil. The specimen is a cross section of a Japanese maple leaf petiole undergoing autofluorescence and imaged with a 10x fluorite objective using an Olympus WBV filter cube. Under ideal conditions, the image presented in Figure 7(b) would be obtained. However, when the excitation filter has too great a bandwidth (allowing unwanted wavelengths to pass), the image loses contrast resulting in the photomicrograph illustrated in Figure 7(a). Choosing the correct filter combination requires knowledge of the spectral values of excitation and emission of the chromophore(s) used to stain the specimen. In this case, the excitation filter passes wavelengths up to 550 nanometers, interfering with green secondary fluorescence emitted by the specimen and severely compromising image contrast.
Controlling specimen contrast in fluorescence microscopy requires that all optical components of the microscope be free of autofluorescence, and that they should not scatter light to a significant degree. This includes internal glass lens elements, mirrors, filters, and beamsplitters. Objectives should provide high image quality while transmitting light with high efficiency down into the near ultraviolet range. Filters must transmit desired wavelengths while blocking others that might interfere with observation of secondary fluorescence. Because excitation light is of far greater intensity than specimen fluorescence, the task of completely removing this light from the fluorescence image is not very easy and requires careful selection of filter combinations that provide a narrow range of excitation wavelengths (usually between 10 and 75 nanometers in bandwidth). When using high numerical aperture immersion objectives, it is critical that the immersion oil be free of contaminants that might exhibit fluorescence. Figure 7(c) illustrates an example of poor contrast generated by autofluorescence in immersion oil. Although the use of immersion oil helps to improve image brightness, partially by eliminating the loss of errant light caused by reflection from surfaces (in particular, the coverslip and glass lens elements), fluorescing contaminants that induce autofluorescence mix unwanted wavelengths with secondary fluorescence from the specimen. This has the unfortunate consequence of brightening the background while simultaneously reducing image contrast, both of which are undesirable.
Excitation and Barrier Filters
Explore color changes with excitation and barrier filter combinations in fluorescence microscopy.
Artifacts in specimen preparation will also produce contrast problems in fluorescence microscopy. Early pioneers in fluorescence often utilized non-specific fluorochromes that produced very bright images due to the fact that the dye molecules were randomly scattered throughout the specimen. Newer fluorescent techniques with improved and highly specific fluorochromes have resulted in specimens exhibiting stained target areas having substantially weaker fluorescence because much less dye is bonded. These newer methods require more careful specimen preparation to avoid unwanted fluorescence artifacts. It is often helpful to pre-stain portions of the specimen with non-fluorescing dyes that compete for binding sites to aid in fluorochrome selectivity. Specimens should be washed thoroughly to remove unbound fluorochrome before placement on acid-cleaned microscope slides made with non-fluorescent glass. Optimization of the fluorochrome environment by addition of chemical additives to minimize photobleaching helps to reduce or eliminate specimen fading. In addition, careful selection of the mounting medium chemical composition and pH is important to obtain the best image from secondary fluorescence. Coverslips and immersion oil should also be non-fluorescent, as discussed above.
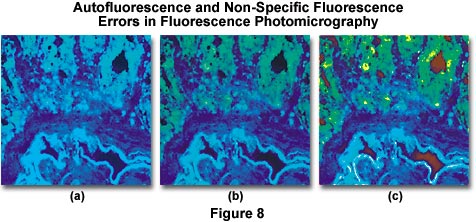
Autofluorescence and/or non-specific fluorescence can occur as a result of the inherent properties of the specimen or through errors in staining. Typical errors of this type are illustrated in Figure 8(a), which shows a thin section of rat colon tissue stained with a mixture of fluorescein-5-isothiocyanate (FITC) and 4',6-diamidino-2-phenylindole (DAPI). The overall blue cast in the photomicrograph is due to a combination of autofluorescence and non-specific fluorescence due to overstaining with the DAPI fluorochrome. Proper staining with both dyes, followed by thorough washing of the specimen results in the photomicrograph presented in Figure 8(b). Errors similar to that illustrated in Figure 8(a) are also caused by using too broad an excitation bandwidth, a reversible mistake that can be corrected by use of filters with narrower bandwidths. Alternatively, a combination of excitation filters can be employed to selectively produce a specific set of wavelengths, or barrier filters can be adjusted to pass only longer wavelengths. Figure 8(c) illustrates the rat colon thin section when stained properly but now with a light red background caused by lack of a red suppression filter in the optical pathway. This error can be corrected by placing the proper suppression filter in the optical path.
Fluorescence photomicrography also suffers from common problems encountered with other forms of optical microscopy and photomicrography. These include focus errors caused by improper adjustment of the focal distance between the optics and film plane, microscope stand vibration, contamination by dirt and debris, underexposure, overexposure, color balance errors, specular reflections (common with long exposures and overhead room lighting), vignetting, and optical microscope mis-alignment. Examples of these errors are presented in our section entitled Fluorescence Photomicrography Errors with Color Transparency Film in the Photomicrography section of the Olympus Microscopy Resource Center Microscopy Primer.
Cameras and Film for Fluorescence Photomicrography - Improvements in film technology have produced increased film speeds and resolution improvements, but there are no color films currently available uniquely suited to fluorescence photomicrography. The specific properties of individual color films, including the characteristic curves for individual emulsion layers, properties of coupled dyes, and the spectral response to light used for fluorescence excitation and emission often vary dramatically from film to film and are sometimes difficult to control and reproduce. These problems lead to difficulty in maintaining accurate color rendering and exposure with color photomicrography using film.
Exposure measurement in fluorescence photomicrography is complicated by the fact that the brightness range within a fluorescent specimen is usually much greater than can be accurately recorded on film. Overexposure of the highlights will result in loss of fine detail and color saturation, while underexposure produces very dark images that do not reveal features hidden in shadowed areas. The background, which is usually very dark or black, is not as critical to either over- or underexposure. Three primary methods are utilized to determine exposure when using fluorescence: brightness measurement with a CCD, photodiode, or photomultiplier, continuous measurement during exposure (photomultiplier), and the least desirable method, trial and error. Modern photomicrography systems designed for fluorescence are equipped with the ability to gauge illumination intensity and calculate exposure times based on this reading. For routine fluorescence photomicrography, some cameras have a silicon blue detector cell for determining exposure duration, while others have a photomultiplier metering detector for measuring extremely faint specimens.
Film Properties
| ISO Number | Light Sensitivity | Resolution | Grain Size | Exposure Tolerance |
|---|---|---|---|---|
| 25-50 | Low | High | Fine | Wide |
| 100-200 | Medium | Medium | Medium | Medium |
| 400+ | High | Low | Coarse | Low |
Table 2
It is important to consider several factors in choosing a detector system for fluorescence photomicrography. These include the detector's noise level and the signal-to-noise ratio for the image, spatial and temporal resolution, geometric distortion, linearity, and spectral sensitivity. In determining proper exposure for fluorescing specimens, it is best to use a camera with a CCD or photomultiplier metering system capable of accurate low-light measurement. Spot metering capability is valuable for measuring the area actually fluorescing and not the unwanted metering of the usual dark background surround the fluorescing material. Another technique involves the use of the exposure adjustment control to reduce exposure times that would otherwise be unduly lengthened by measuring the dark background of the field of view. In this respect, Olympus and Nikon offer camera systems that have built-in algorithms for reducing exposure if the camera is set for fluorescence mode. When light is scant (usually most of the time with fluorescence), set the trinocular prism to send all the light up to the film plane to reduce exposure time.
Ideally, a spot meter should be included in the photomicrography system to aid in determining exposure when only a few bright objects are visible on an otherwise dark background. For integrated light measurements made over the entire viewfield without a spot meter, the exposure time should be cut in half or to a fourth of the metered reading (for scattered fluorescing objects on a dark background), much like the situation with darkfield microscopy. If the spot meter light sensor is in a fixed position in the middle of the viewfield, the specimen must first be moved to the center of the field to obtain a suitable area for exposure measurement, then relocated to compose the photomicrograph. High-end camera systems allow translation of the spot meter sensor to enable the microscopist to determine photomicrograph composition prior to exposure measurement. After positioning of the specimen for photomicrography, the spot meter sensor can then be moved to the brightest area in the viewfield for exposure measurement without disturbing the specimen. When using a spot meter, make certain the fluorescent object is large enough to fill the spot and record an accurate exposure reading.
Some photomicrography camera systems provide a permanent beamsplitter assembly that directs a portion of the light to a photometer, which allows light measurement during the actual exposure in order to compensate for fading. This is a convenient method for adjusting exposure times on the fly to avoid photobleaching artifacts, but it has the disadvantage of reducing light intensity directed to the film, necessitating a longer exposure. More advanced computer-aided camera systems are able to compensate for reciprocity failure and fading through a pre-programmed lookup table conveniently stored in the metering system's memory. Automatic correction for reciprocity failure by camera system computers operate by applying the following equation to exposure calculations:
where Tc is the corrected exposure time, Tm is the metered (uncorrected) time, and p is a constant determined from reciprocity values for individual films housed in the system's lookup table. This system is limited by the amount and type of reciprocity data for films that are added to the lookup table during initial programming of the metering system.
Without an integral exposure metering system, determination of exposure time must be made by trail and error. This method involves making a series of trial exposures at a variety of exposure times, stepped through increments of one-half to a full f-stop (bracketing). After processing the film, the exposure that produces the best result is carefully noted and provides the basis for further photomicrography using the identical microscope configuration. Changes to specimen illumination or microscope setup will necessitate another series of exposure brackets to determine the new optimum exposure time. If only the objective magnification is changed, new exposure times can be calculated from previously recorded bracket data. Many photomicrographers doing fluorescence microscopy bracket their exposures, both over and under by three or more intervals, to make certain that they will secure a correct exposure at one of the settings. Keeping good written records of exposure and associated equipment data can reduce or eliminate the need for future bracketing. When determining exposure using the trial and error method, it is wise to continuously monitor the microscope lamp output for deviations in illumination that occur as the lamp ages. Microscopists using this method of exposure determination often rely on SLR cameras to capture images with fluorescence illumination. With these cameras, movement of the shutter and viewfinder mirror during exposure may cause vibrations that lead to unsharp images. This problem can usually be circumvented by using a remote shutter switch and/or raising the mirror prior making the exposure. In some cameras, operation of the self-timer releases the mirror, which allows time for vibrations to cease before the exposure is made.
Illuminated Reticles
Practice examining fluorescence specimens with illuminated reticles by adjusting the focus and color of the reticle.
Microscopes equipped specifically for fluorescence illumination often have an illuminated reticle in the system or focusing telescope, which allows the microscopist to visualize a photomicrography grating superimposed over faintly visible specimens positioned against a very dark background. Both Olympus and Nikon provide reticles in their high-end microscopes that offer a choice of crosshair and film frame colors with which to view the specimen. Microscopists can choose between a red or yellow illuminated reticle. The red reticle has the advantage of maintaining the dark adaptation of the observer's eye and provides excellent contrast when viewed over blue and green secondary fluorescence. For red fluorescence and when simultaneous phase contrast or DIC are used, the yellow reticle should be selected to maximize contrast. Some manufacturers offer a focusing telescope with illuminated framing reticle that attaches to the automatic camera housing and allows viewing of the film frame dimensions over the dark background field.
When choosing film for fluorescence photomicrography, the film speed (ASA or ISO rating) is a variable that should be carefully considered. The higher the ISO rating, other things being equal, the less the amount of light necessary to register a satisfactory image on the film. Illumination sources used in fluorescence microscopy require daylight-balanced film emulsions to accurately render specimen secondary fluorescence colors. Most major film manufacturers offer a wide spectrum of daylight films at a variety of ISO ratings in both transparency and color negative formats. Kodak daylight Ektachrome with an ISO of 200 or 400 or Kodachrome 200, both in 35 millimeter size, are positive transparency films that display adequate speed, good color rendition and acceptable resolution. Fujichrome Provia is offered in 400 and 1600 ISO ratings, and is an excellent transparency film in terms of color saturation and resolution. Other manufacturers make comparable transparency films, but we suggest avoiding the use of color negative film if at all possible.
For black & white film, Kodak offers T-Max 400, an excellent fine to medium grain film that is one of the best for fluorescence applications. Several black & white films are available that can be processed with standard color negative chemicals (C41). These include Kodak T-Max 400CN, Kodak Advantix, and Ilford XP-2 Super, all of which are offered in ISO ratings of 400. Keep in mind that faster films allow for much shorter exposure times at the expense of increased grain size. Table 2 lists basic film properties for reference.
Contrast, one of the greatest concerns in fluorescence photomicrography, depends not only on microscope configuration, but also upon the physical characteristics of the film chosen, the development process, exposure details, and the specimen itself with respect to the efficiency of staining by the fluorochrome and photobleaching or fading. Color transparency films can be underexposed by one or several f-stops (a bonus when considering reciprocity and fading), then push processed by extending processing time in the first developer to increase contrast and color saturation. Many black & white films can produce variations in contrast that are dependent upon the developer mixing conditions and processing time. Resolution of film in fluorescence photomicrography is determined principally by the optical parameters of the microscope (primarily the objective numerical aperture) and how well it is configured, but is also somewhat dependent upon film characteristics and development methods. In practice however, the film resolution only becomes a factor when the microscope is not performing optimally or the ISO speed is so high that grain becomes a factor.
Recent advances in digital imaging technology have revolutionized capture of photomicrographs using charge-coupled devices (CCDs). When imaging multiply-stained fluorescence specimens, digital cameras provide an excellent solution and are rapidly becoming the medium of choice for many photomicrographers. The price of three-chip integrating color CCD cameras has dropped to an affordable range and, when coupled to a frame-grabber or digital video card and computer, offer an excellent method of collecting, digitizing, editing, and storing fluorescence images.
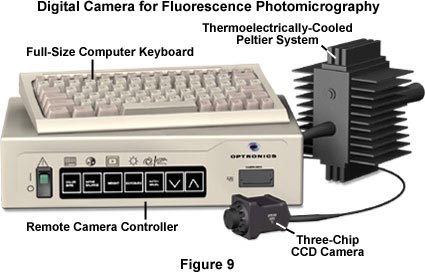
The weak fluorescence displayed by many specimens necessitates high performance in CCD detector specifications. Currently, the best choice is a back-thinned frame or interline transfer device, which is equipped with heat sinks and/or external reservoirs for cooling. Many of these cameras have a quantum efficiency approaching or exceeding 90 percent and permit the sequential acquisition of several images before readout. Image acquisition cycles run from one to five seconds, depending on the readout rate, video capture parameters, and CCD resolution. A typical CCD camera matching these specifications is the Optronics MagnaFire digital imaging camera system designed for scientific applications. This camera has a SONY ICX085AL 2/3-inch interline transfer CCD with an array size of 1300 × 1030 and a (square) pixel size of 6.7 microns. Camera performance is enhanced with a 60 dB dynamic range and signal-to-noise ratio, a file bit depth of 24, 32, or 48 bit color, a dark current of 4 electrons per pixel/second with a 16,000 electron well depth, and sealed gas Peltier CCD cooling. Color image formation is via multiple dichroic optical glass color filters. Optronics and other manufacturers also offer a wide spectrum of digital cameras (a typical CCD camera is illustrated in Figure 9) suited to almost every need in both fluorescence and routine optical microscopy.
The following points summarize important aspects of fluorescence photomicrography.
- Use high numerical aperture objectives equipped with glass or quartz lenses that are transparent to near ultraviolet light. Also use the lowest magnification projection lens possible to limit the total magnification.
- Reflected light fluorescence is preferred to transmitted light fluorescence. If it is not possible to configure the microscope for reflected light, use a transmitted light darkfield condenser.
- Optimize specimen contrast by careful choice of film parameters, proper microscope configuration, and by carefully matching chromophore excitation and secondary fluorescence properties to the proper excitation and barrier filters.
- Remove the trinocular beamsplitter prism from the light path to allow 100 percent of the light to reach the film plane during exposure. Also use 35 millimeter film and avoid larger film formats.
- Choose daylight balanced transparency films for the best rendition of specimen colors, resolution, and contrast. Push process transparency films for enhanced contrast and color saturation.
- The light source must provide high-intensity radiation in very narrow ranges of the spectrum, typically between 10 and 50 nanometers. The best choices are xenon and mercury vapor lamps or lasers tuned to specific wavelengths.
- The microscope optical train, including lenses, mirrors, filters, beamsplitters, immersion media, microscope slides, and coverslips, should be free of autofluorescing components.
- When not viewing or photographing fluorescence specimens, block the excitation light using the filter slider or shutter in the illuminator to avoid specimen damage by photobleaching.
- Always provide a heat filter between the illuminator and fluorescence filters, which may be damaged by excess heat.
- Monitor the lamp for signs of flicker and replace when illumination intensity becomes uneven. Keep the lamp and vertical illuminator adjusted for proper Köhler illumination.
- Prepare specimens carefully and remove excess chromophores by thorough washing after staining.
In conclusion, the field of fluorescence microscopy is rapidly expanding in many medical and biological research laboratories. The mainstream of fluorescence microscopy has undergone an almost total shift from utilizing transmitted light to incident light, accompanied by the introduction of many new and different fluorochromes. This has been an impetus for spurring many new and varied fluorescence microscopy applications.