Automating Migration Assay Imaging and Quantification Using an Incubation Monitoring System
Experimental Outline
Cell migration information can be valuable in many areas of research, such as wound healing and cancer. In the field of wound healing, it is used to evaluate drugs that promote cell migration to close wounds. In the field of cancer, it is used to assess drugs that suppress the metastasis and infiltration of cancer cells. One way to measure this is through a migration assay, where adherent cells on a tissue culture dish are observed migrating into a cell-free gap. The most important and challenging part of performing a migration assay is determining appropriate migration durations. A migration assay that is analyzed too early fails to show differences between conditions, while one that is analyzed too late results in the open areas being completely filled with cells in both test and control conditions. Previously, a researcher needed to manually image the migration assay at the correct timepoint to get the data necessary for quantification, then manually apply their quantification method.
Here we report the analysis of the cell migration inhibitory effects of the anticancer drug sorafenib on the MCF7 human breast cancer cell line. We also demonstrate how imaging and quantification of migration assays can be automated using the Olympus Provi™ CM20 incubation monitoring system.
Experimental Procedures
MCF7 cells were cultured in RPMI-1640 medium supplemented with 10% fetal bovine serum (FBS) and 1% Penicillin-Streptomycin. Cells were seeded on a 24-well plate using an Ibidi Culture-Insert 2 Well (ibidi, Cat. No. ib80209) at a density of 105,000 cells/70 μL/chamber. The Ibidi Culture-Insert 2 Well was removed 24 hours after seeding, creating a gap for cell migration. Cells were washed three times and treated with sorafenib (10 or 30 μM) or were left as untreated controls. The CM20 monitor automatically imaged the cells every one hour for up to 94 hours to quantify confluency for the assessment of cell migration.
Results
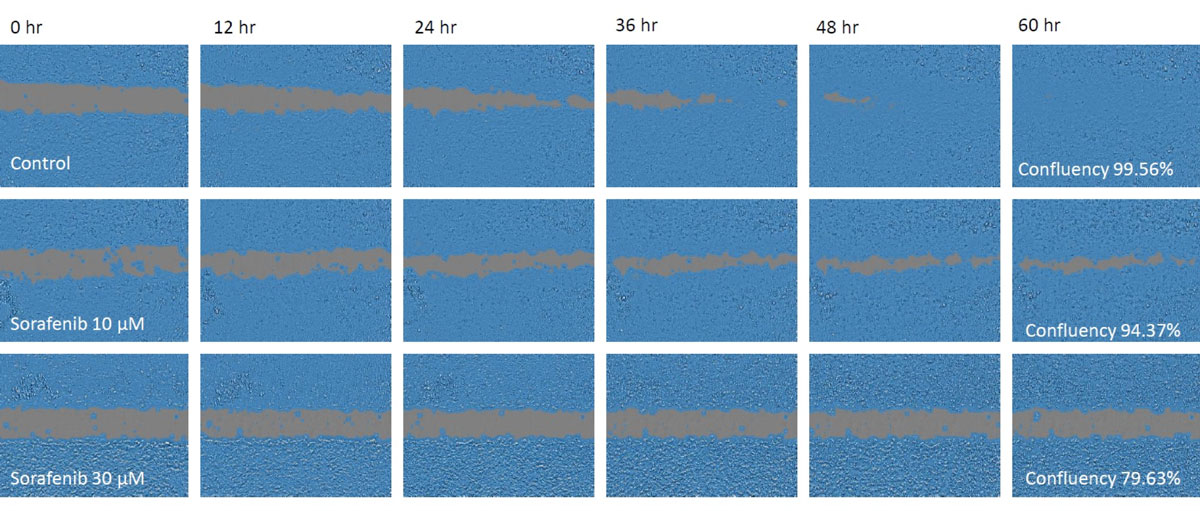
Figure 1. Cell images during a migration assay.
Upper: control, middle: 10 μM sorafenib, lower: 30 μM sorafenib. The masked areas indicate confluent areas automatically detected by the CM20 monitor.
Cell migration was reduced in both sorafenib-treated groups in proportion to the sorafenib concentration and was still open at 48 hours, whereas the control had closed by this timepoint.
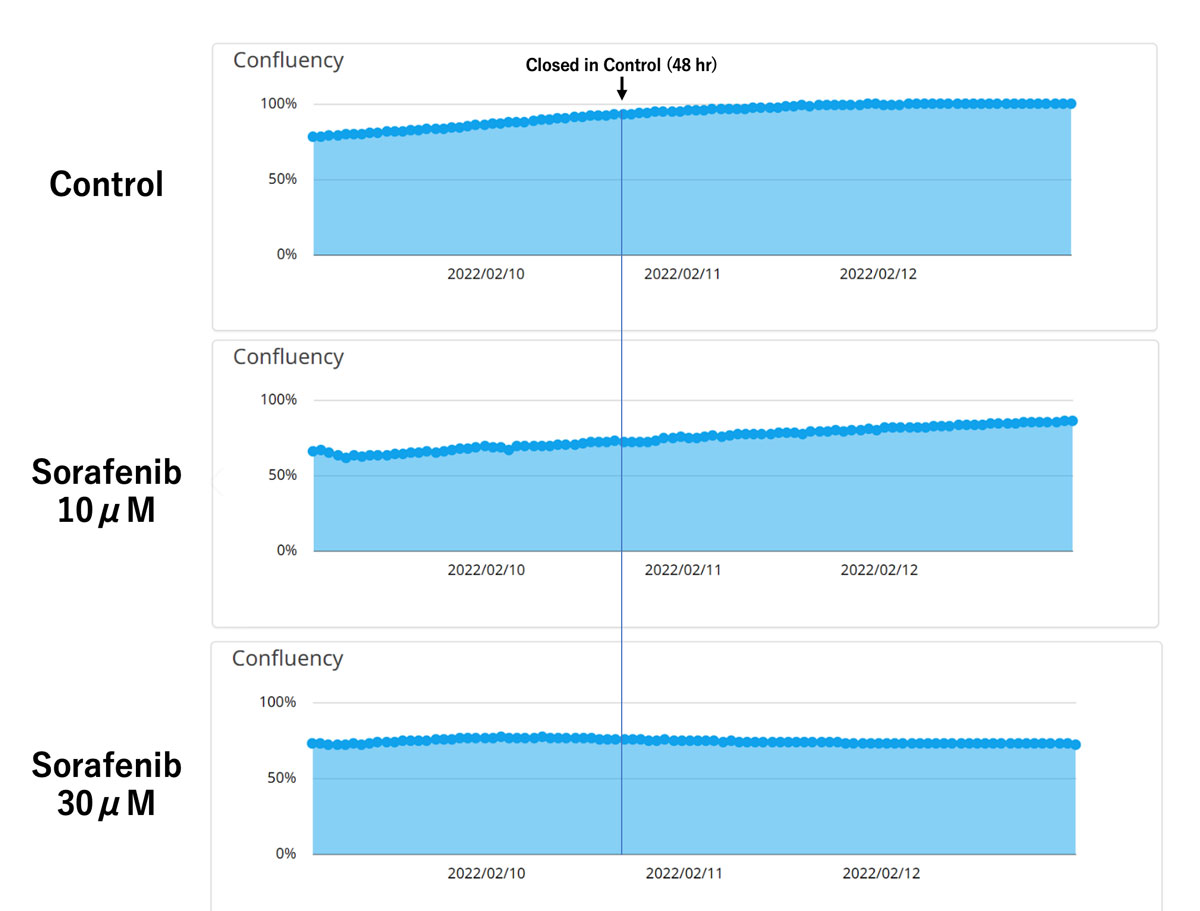
Figure 2. Quantification of confluency in a migration assay.
Upper: control, middle: 10 μM sorafenib, lower: 30 μM sorafenib.
Quantification of confluency with the CM20 monitor showed agreement with the results of the cell observations. The control cells showed nearly 100% confluency at 48 hours, while the sorafenib-treated cells showed lower confluency in proportion to the sorafenib concentration.
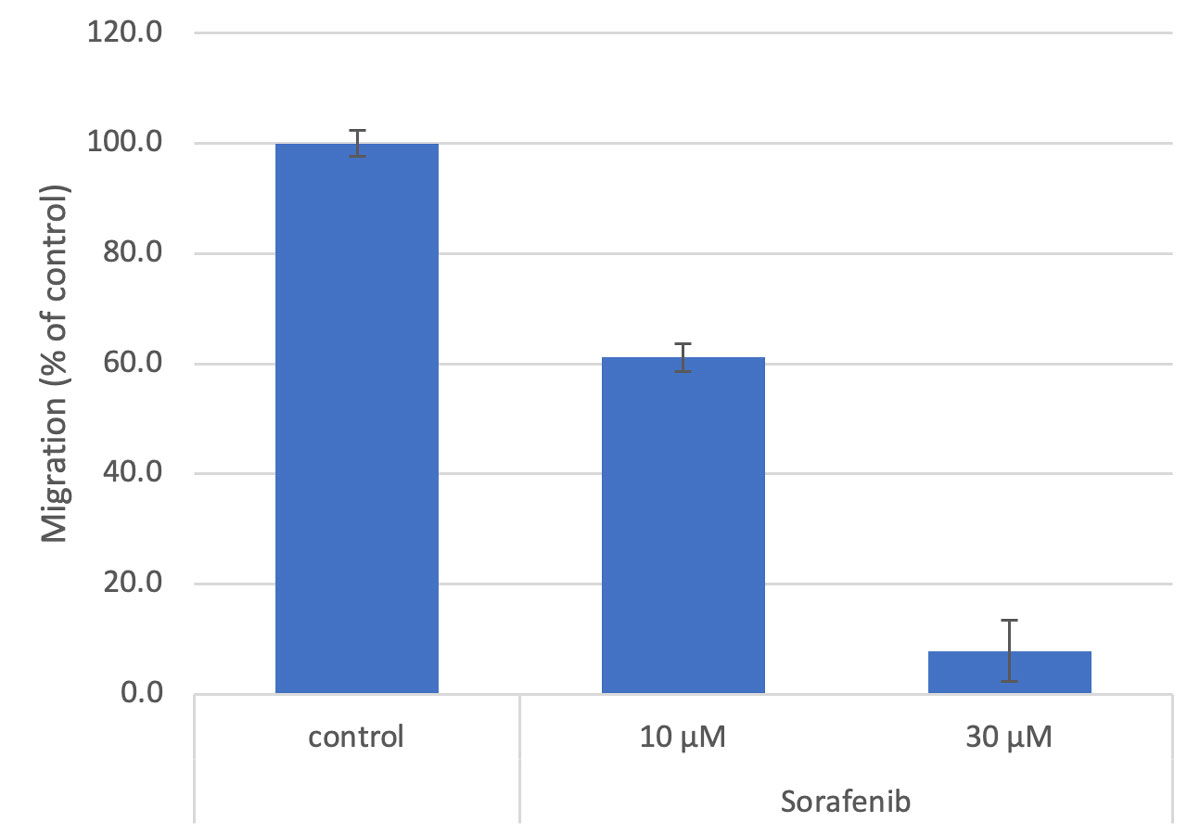
Figure 3. Quantitation of closure relative to control at 48 hours.
Bar = mean ± SE, n=3
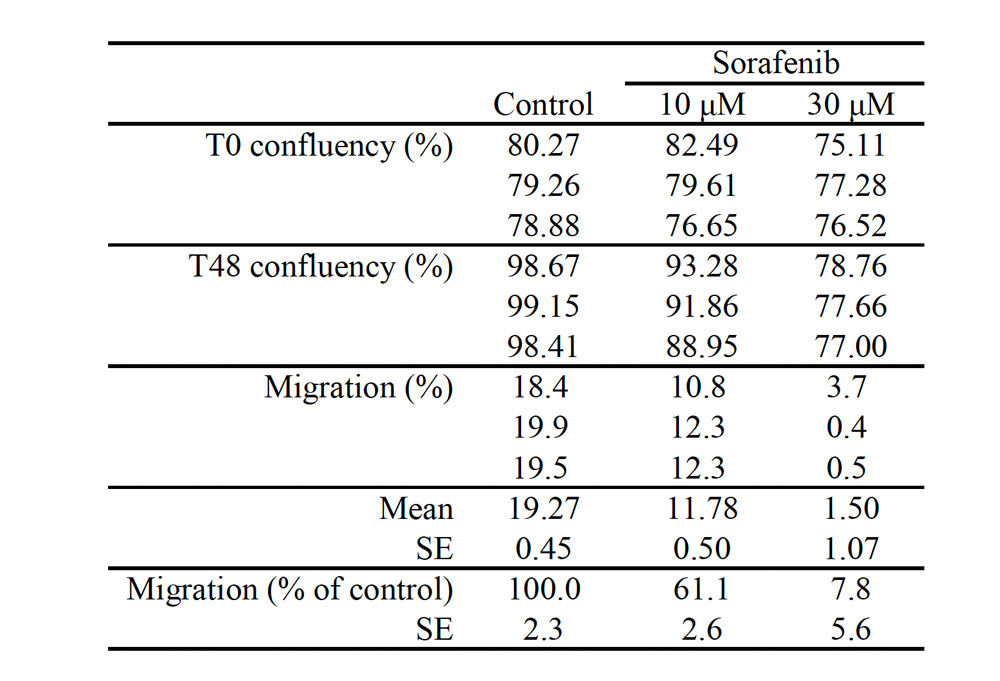
Table 1. Quantitation of cell migration in a migration assay.
Cell migration was determined by subtracting the levels of confluency at the start of treatment from those after 48-hour treatments. Cell migration was found to be significantly inhibited in proportion to the sorafenib concentrations.
Benefits of the Assessments Using the Incubation Monitoring System
We could effectively detect the cell migration inhibitory effects of the anticancer drug in a migration assay using the CM20 incubation monitoring system.
Setting the appropriate measurement time is essential in a migration assay. The effects of drugs can be best detected when assessed at the time of complete migration for the fastest condition (i.e., control group in this analysis). Previously, it was necessary to observe cells every few hours to check migration, and therefore plan experiments around the availability of the researcher. Even then, there was the risk of a complete migration overnight. The CM20 monitor solves this problem by automatically imaging and quantifying cell migration over time. The system enables the user to then analyze the cells at their convenience, greatly improving workflow efficiency. Using an incubation monitoring system for migration experiments has the potential to save researchers time, improve accuracy and consistency, and lead to more successful assays.
Acknowledgments
This application note was prepared with the help of the following researcher:
Takahiro Yamaguchi, PhD, Principal Researcher, ACEL, Inc.
Products related to this application
Sorry, this page is not
available in your country.