Fluorescence Excitation and Emission Fundamentals
Fluorescence is a member of the ubiquitous luminescence family of processes in which susceptible molecules emit light from electronically excited states created by either a physical (for example, absorption of light), mechanical (friction), or chemical mechanism. Generation of luminescence through excitation of a molecule by ultraviolet or visible light photons is a phenomenon termed photoluminescence, which is formally divided into two categories, fluorescence and phosphorescence, depending upon the electronic configuration of the excited state and the emission pathway. Fluorescence is the property of some atoms and molecules to absorb light at a particular wavelength and to subsequently emit light of longer wavelength after a brief interval, termed the fluorescence lifetime. The process of phosphorescence occurs in a manner similar to fluorescence, but with a much longer excited state lifetime.
The fluorescence process is governed by three important events, all of which occur on timescales that are separated by several orders of magnitude (see Table 1). Excitation of a susceptible molecule by an incoming photon happens in femtoseconds (10E-15 seconds), while vibrational relaxation of excited state electrons to the lowest energy level is much slower and can be measured in picoseconds (10E-12 seconds). The final process, emission of a longer wavelength photon and return of the molecule to the ground state, occurs in the relatively long time period of nanoseconds (10E-9 seconds). Although the entire molecular fluorescence lifetime, from excitation to emission, is measured in only billionths of a second, the phenomenon is a stunning manifestation of the interaction between light and matter that forms the basis for the expansive fields of steady state and time-resolved fluorescence spectroscopy and microscopy. Because of the tremendously sensitive emission profiles, spatial resolution, and high specificity of fluorescence investigations, the technique has rapidly become an important tool in genetics and cell biology.
Several investigators reported luminescence phenomena during the seventeenth and eighteenth centuries, but it was British scientist Sir George G. Stokes who first described fluorescence in 1852 and was responsible for coining the term in honor of the blue-white fluorescent mineral fluorite (fluorspar). Stokes also discovered the wavelength shift to longer values in emission spectra that bears his name. Fluorescence was first encountered in optical microscopy during the early part of the twentieth century by several notable scientists, including August Köhler and Carl Reichert, who initially reported that fluorescence was a nuisance in ultraviolet microscopy. The first fluorescence microscopes were developed between 1911 and 1913 by German physicists Otto Heimstädt and Heinrich Lehmann as a spin-off from the ultraviolet instrument. These microscopes were employed to observe autofluorescence in bacteria, animal, and plant tissues. Shortly thereafter, Stanislav Von Provazek launched a new era when he used fluorescence microscopy to study dye binding in fixed tissues and living cells. However, it wasn't until the early 1940s that Albert Coons developed a technique for labeling antibodies with fluorescent dyes, thus giving birth to the field of immunofluorescence. By the turn of the twenty-first century, the field of fluorescence microscopy was responsible for a revolution in cell biology, coupling the power of live cell imaging to highly specific multiple labeling of individual organelles and macromolecular complexes with synthetic and genetically encoded fluorescent probes.
Timescale Range for Fluorescence Processes
| Transition | Process | Rate Constant | Timescale (Seconds) |
|---|---|---|---|
| S(0) => S(1) or S(n) | Absorption (Excitation) | Instantaneous | 10-15 |
| S(n) => S(1) | Internal Conversion | k(ic) | 10-14 to 10-10 |
| S(1) => S(1) | Vibrational Relaxation | k(vr) | 10-12 to 10-10 |
| S(1) => S(0) | Fluorescence | k(f) or Γ | 10-9 to 10-7 |
| S(1) => T(1) | Intersystem Crossing | k(pT) | 10-10 to 10-8 |
| S(1) => S(0) | Non-Radiative Relaxation Quenching | k(nr), k(q) | 10-7 to 10-5 |
| T(1) => S(0) | Phosphorescence | k(p) | 10-3 to 100 |
| T(1) => S(0) | Non-Radiative Relaxation Quenching | k(nr), k(qT) | 10-3 to 100 |
Table 1
Fluorescence is generally studied with highly conjugated polycyclic aromatic molecules that exist at any one of several energy levels in the ground state, each associated with a specific arrangement of electronic molecular orbitals. The electronic state of a molecule determines the distribution of negative charge and the overall molecular geometry. For any particular molecule, several different electronic states exist (illustrated as S(0), S(1), and S(2) in Figure 1), depending on the total electron energy and the symmetry of various electron spin states. Each electronic state is further subdivided into a number of vibrational and rotational energy levels associated with the atomic nuclei and bonding orbitals. The ground state for most organic molecules is an electronic singlet in which all electrons are spin-paired (have opposite spins). At room temperature, very few molecules have enough internal energy to exist in any state other than the lowest vibrational level of the ground state, and thus, excitation processes usually originate from this energy level.
The category of molecules capable of undergoing electronic transitions that ultimately result in fluorescence are known as fluorescent probes, fluorochromes, or simply dyes. Fluorochromes that are conjugated to a larger macromolecule (such as a nucleic acid, lipid, enzyme, or protein) through adsorption or covalent bonds are termed fluorophores. In general, fluorophores are divided into two broad classes, termed intrinsic and extrinsic. Intrinsic fluorophores, such as aromatic amino acids, neurotransmitters, porphyrins, and green fluorescent protein, are those that occur naturally. Extrinsic fluorophores are synthetic dyes or modified biochemicals that are added to a specimen to produce fluorescence with specific spectral properties.
Absorption, Excitation, and Emission
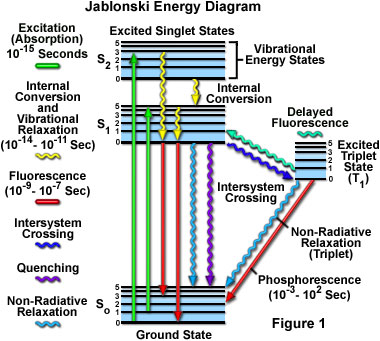
Absorption of energy by fluorochromes occurs between the closely spaced vibrational and rotational energy levels of the excited states in different molecular orbitals. The various energy levels involved in the absorption and emission of light by a fluorophore are classically presented by a Jablonski energy diagram (see Figure 1), named in honor of the Polish physicist Professor Alexander Jablonski. A typical Jablonski diagram illustrates the singlet ground (S(0)) state, as well as the first (S(1)) and second (S(2)) excited singlet states as a stack of horizontal lines. In Figure 1, the thicker lines represent electronic energy levels, while the thinner lines denote the various vibrational energy states (rotational energy states are ignored). Transitions between the states are illustrated as straight or wavy arrows, depending upon whether the transition is associated with absorption or emission of a photon (straight arrow) or results from a molecular internal conversion or non-radiative relaxation process (wavy arrows). Vertical upward arrows are utilized to indicate the instantaneous nature of excitation processes, while the wavy arrows are reserved for those events that occur on a much longer timescale.
Absorption of light occurs very quickly (approximately a femtosecond, the time necessary for the photon to travel a single wavelength) in discrete amounts termed quanta and corresponds to excitation of the fluorophore from the ground state to an excited state. Likewise, emission of a photon through fluorescence or phosphorescence is also measured in terms of quanta. The energy in a quantum (Planck's Law) is expressed by the equation:
E = hν = hc/λ
where E is the energy, h is Planck's constant, ν and λ are the frequency and wavelength of the incoming photon, and c is the speed of light. Planck's Law dictates that the radiation energy of an absorbed photon is directly proportional to the frequency and inversely proportional to the wavelength, meaning that shorter incident wavelengths possess a greater quantum of energy. The absorption of a photon of energy by a fluorophore, which occurs due to an interaction of the oscillating electric field vector of the light wave with charges (electrons) in the molecule, is an all or none phenomenon and can only occur with incident light of specific wavelengths known as absorption bands. If the absorbed photon contains more energy than is necessary for a simple electronic transition, the excess energy is usually converted into vibrational and rotational energy. However, if a collision occurs between a molecule and a photon having insufficient energy to promote a transition, no absorption occurs. The spectrally broad absorption band arises from the closely spaced vibrational energy levels plus thermal motion that enables a range of photon energies to match a particular transition. Because excitation of a molecule by absorption normally occurs without a change in electron spin-pairing, the excited state is also a singlet. In general, fluorescence investigations are conducted with radiation having wavelengths ranging from the ultraviolet to the visible regions of the electromagnetic spectrum (250 to 700 nanometers).
With ultraviolet or visible light, common fluorophores are usually excited to higher vibrational levels of the first (S(1)) or second (S(2)) singlet energy state. One of the absorption (or excitation) transitions presented in Figure 1 (left-hand green arrow) occurs from the lowest vibrational energy level of the ground state to a higher vibrational level in the second excited state (a transition denoted as S(0) = 0 to S(2) = 3). A second excitation transition is depicted from the second vibrational level of the ground state to the highest vibrational level in the first excited state (denoted as S(0) = 1 to S(1) = 5). In a typical fluorophore, irradiation with a wide spectrum of wavelengths will generate an entire range of allowed transitions that populate the various vibrational energy levels of the excited states. Some of these transitions will have a much higher degree of probability than others, and when combined, will constitute the absorption spectrum of the molecule. Note that for most fluorophores, the absorption and excitation spectra are distinct, but often overlap and can sometimes become indistinguishable. In other cases (fluorescein, for example) the absorption and excitation spectra are clearly separated.
Immediately following absorption of a photon, several processes will occur with varying probabilities, but the most likely will be relaxation to the lowest vibrational energy level of the first excited state (S(1) = 0; Figure 1). This process is known as internal conversion or vibrational relaxation (loss of energy in the absence of light emission) and generally occurs in a picosecond or less. Because a significant number of vibration cycles transpire during the lifetime of excited states, molecules virtually always undergo complete vibrational relaxation during their excited lifetimes. The excess vibrational energy is converted into heat, which is absorbed by neighboring solvent molecules upon colliding with the excited state fluorophore.
An excited molecule exists in the lowest excited singlet state (S(1)) for periods on the order of nanoseconds (the longest time period in the fluorescence process by several orders of magnitude) before finally relaxing to the ground state. If relaxation from this long-lived state is accompanied by emission of a photon, the process is formally known as fluorescence. The closely spaced vibrational energy levels of the ground state, when coupled with normal thermal motion, produce a wide range of photon energies during emission. As a result, fluorescence is normally observed as emission intensity over a band of wavelengths rather than a sharp line. Most fluorophores can repeat the excitation and emission cycle many hundreds to thousands of times before the highly reactive excited state molecule is photobleached, resulting in the destruction of fluorescence. For example, the well-studied probe fluorescein isothiocyanate (FITC) can undergo excitation and relaxation for approximately 30,000 cycles before the molecule no longer responds to incident illumination.
Several other relaxation pathways that have varying degrees of probability compete with the fluorescence emission process. The excited state energy can be dissipated non-radiatively as heat (illustrated by the cyan wavy arrow in Figure 1), the excited fluorophore can collide with another molecule to transfer energy in a second type of non-radiative process (for example, quenching, as indicated by the purple wavy arrow in Figure 1), or a phenomenon known as intersystem crossing to the lowest excited triplet state can occur (the blue wavy arrow in Figure 1). The latter event is relatively rare, but ultimately results either in emission of a photon through phosphorescence or a transition back to the excited singlet state that yields delayed fluorescence. Transitions from the triplet excited state to the singlet ground state are forbidden, which results in rate constants for triplet emission that are several orders of magnitude lower than those for fluorescence.
Both of the triplet state transitions are diagrammed on the right-hand side of the Jablonski energy profile illustrated in Figure 1. The low probability of intersystem crossing arises from the fact that molecules must first undergo spin conversion to produce unpaired electrons, an unfavorable process. The primary importance of the triplet state is the high degree of chemical reactivity exhibited by molecules in this state, which often results in photobleaching and the production of damaging free radicals. In biological specimens, dissolved oxygen is a very effective quenching agent for fluorophores in the triplet state. The ground state oxygen molecule, which is normally a triplet, can be excited to a reactive singlet state, leading to reactions that bleach the fluorophore or exhibit a phototoxic effect on living cells. Fluorophores in the triplet state can also react directly with other biological molecules, often resulting in deactivation of both species. Molecules containing heavy atoms, such as the halogens and many transition metals, often facilitate intersystem crossing and are frequently phosphorescent.
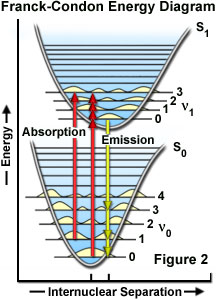
The probability of a transition occurring from the ground state (S(0)) to the excited singlet state (S(1)) depends on the degree of similarity between the vibrational and rotational energy states when an electron resides in the ground state versus those present in the excited state, as outlined in Figure 2. The Franck-Condon energy diagram illustrated in Figure 2 presents the vibrational energy probability distribution among the various levels in the ground (S(0)) and first excited (S(1)) states for a hypothetical molecule. Excitation transitions (red lines) from the ground to the excited state occur in such a short timeframe (femtoseconds) that the internuclear distance associated with the bonding orbitals does not have sufficient time to change, and thus the transitions are represented as vertical lines. This concept is referred to as the Franck-Condon Principle. The wavelength of maximum absorption (red line in the center) represents the most probable internuclear separation in the ground state to an allowed vibrational level in the excited state.
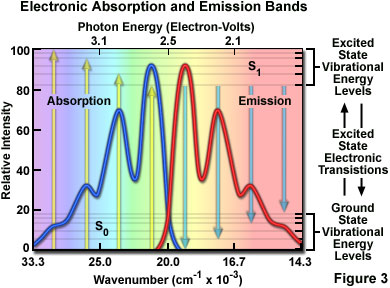
At room temperature, thermal energy is not adequate to significantly populate excited energy states and the most likely state for an electron is the ground state (S(O)), which contains a number of distinct vibrational energy states, each with differing energy levels. The most favored transitions will be the ones where the rotational and vibrational electron density probabilities maximally overlap in both the ground and excited states (see Figure 2). However, incident photons of varying wavelength (and quanta) may have sufficient energy to be absorbed and often produce transitions from other internuclear separation distances and vibrational energy levels. This effect gives rise to an absorption spectrum containing multiple peaks (Figure 3). The wide range of photon energies associated with absorption transitions in fluorophores causes the resulting spectra to appear as broad bands rather than discrete lines.
The hypothetical absorption spectrum illustrated in Figure 3 (blue band) results from several favored electronic transitions from the ground state to the lowest excited energy state (labeled S(0) and S(1), respectively). Superimposed over the absorption spectrum are vertical lines (yellow) representing the transitions from the lowest vibrational level in the ground state to higher vibrational energy levels in the excited state. Note that transitions to the highest excited vibrational levels are those occurring at higher photon energies (lower wavelength or higher wavenumber). The approximate energies associated with the transitions are denoted in electron-volts (eV) along the upper abscissa of Figure 3. Vibrational levels associated with the ground and excited states are also included along the right-hand ordinate.
Scanning through the absorption spectrum of a fluorophore while recording the emission intensity at a single wavelength (usually the wavelength of maximum emission intensity) will generate the excitation spectrum. Likewise, exciting the fluorophore at a single wavelength (again, preferably the wavelength of maximum absorption) while scanning through the emission wavelengths will reveal the emission spectral profile. The excitation and emission spectra may be considered as probability distribution functions that a photon of given quantum energy will be absorbed and ultimately enable the fluorophore to emit a second photon in the form of fluorescence radiation.
Stokes Shift and the Mirror Image Rule
If the fluorescence emission spectrum of a fluorophore is carefully scrutinized, several important features become readily apparent. The emission spectrum is independent of the excitation energy (wavelength) as a consequence of rapid internal conversion from higher initial excited states to the lowest vibrational energy level of the S(1) excited state. For many of the common fluorophores, the vibrational energy level spacing is similar for the ground and excited states, which results in a fluorescence spectrum that strongly resembles the mirror image of the absorption spectrum. This is due to the fact that the same transitions are most favorable for both absorption and emission. Finally, in solution (where fluorophores are generally studied) the detailed vibrational structure is generally lost and the emission spectrum appears as a broad band.
As previously discussed, following photon absorption, an excited fluorophore will quickly undergo relaxation to the lowest vibrational energy level of the excited state. An important consequence of this rapid internal conversion is that all subsequent relaxation pathways (fluorescence, non-radiative relaxation, intersystem crossing, etc.) proceed from the lowest vibrational level of the excited state (S(1)). As with absorption, the probability that an electron in the excited state will return to a particular vibrational energy level in the ground state is proportional to the overlap between the energy levels in the respective states (Figure 2). Return transitions to the ground state (S(0)) usually occur to a higher vibrational level (see Figure 3), which subsequently reaches thermal equilibrium (vibrational relaxation). Because emission of a photon often leaves the fluorophore in a higher vibrational ground state, the emission spectrum is typically a mirror image of the absorption spectrum resulting from the ground to first excited state transition. In effect, the probability of an electron returning to a particular vibrational energy level in the ground state is similar to the probability of that electron's position in the ground state before excitation. This concept, known as the Mirror Image Rule, is illustrated in Figure 3 for the emission transitions (blue lines) from the lowest vibrational energy level of the excited state back to various vibrational levels in ground state. The resulting emission spectrum (red band) is a mirror image of the absorption spectrum displayed by the hypothetical chromophore.
In many cases, excitation by high energy photons leads to the population of higher electronic and vibrational levels (S(2), S(3), etc.), which quickly lose excess energy as the fluorophore relaxes to the lowest vibrational level of the first excited state (see Figure 1). Because of this rapid relaxation process, emission spectra are generally independent of the excitation wavelength (some fluorophores emit from higher energy states, but such activity is rare). For this reason, emission is the mirror image of the ground state to lowest excited state transitions, but not of the entire absorption spectrum, which may include transitions to higher energy levels. An excellent test of the mirror image rule is to examine absorption and emission spectra in a linear plot of the wavenumber (the reciprocal of wavelength or the number of waves per centimeter), which is directly proportional to the frequency and quantum energy. When presented in this manner (see Figure 3), symmetry between extinction coefficients and intensity of the excitation and emission spectra as a function of energy yield mirrored spectra when reciprocal transitions are involved.
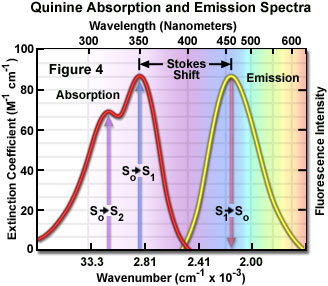
Presented in Figure 4 are the absorption and emission spectra for quinine, the naturally occurring antimalarial agent (and first known fluorophore) whose fluorescent properties were originally described by Sir John Fredrick William Hershel in 1845. Quinine does not adhere to the mirror image rule as is evident by inspecting the single peak in the emission spectrum (at 460 nanometers), which does not mirror the two peaks at 310 and 350 nanometers featured in the bimodal absorption spectrum. The shorter wavelength ultraviolet absorption peak (310 nanometers) is due to an excitation transition to the second excited state (from S(0) to S(2)) that quickly relaxes to the lowest excited state (S(1)). As a consequence, fluorescence emission occurs exclusively from the lowest excited singlet state (S(1)), resulting in a spectrum that mirrors the ground to first excited state transition (350 nanometer peak) in quinine and not the entire absorption spectrum.
Because the energy associated with fluorescence emission transitions (see Figures 1-4) is typically less than that of absorption, the resulting emitted photons have less energy and are shifted to longer wavelengths. This phenomenon is generally known as Stokes Shift and occurs for virtually all fluorophores commonly employed in solution investigations. The primary origin of the Stokes shift is the rapid decay of excited electrons to the lowest vibrational energy level of the S(1) excited state. In addition, fluorescence emission is usually accompanied by transitions to higher vibrational energy levels of the ground state, resulting in further loss of excitation energy to thermal equilibration of the excess vibrational energy. Other events, such as solvent orientation effects, excited-state reactions, complex formation, and resonance energy transfer can also contribute to longer emission wavelengths.
In practice, the Stokes shift is measured as the difference between the maximum wavelengths in the excitation and emission spectra of a particular fluorochrome or fluorophore. The size of the shift varies with molecular structure, but can range from just a few nanometers to over several hundred nanometers. For example, the Stokes shift for fluorescein is approximately 20 nanometers, while the shift for quinine is 110 nanometers (see Figure 4) and that for the porphyrins is over 200 nanometers. The existence of Stokes shift is critical to the extremely high sensitivity of fluorescence imaging measurements. The red emission shift enables the use of precision bandwidth optical filters to effectively block excitation light from reaching the detector so the relatively faint fluorescence signal (having a low number of emitted photons) can be observed against a low-noise background.
Sorry, this page is not
available in your country.