Drug Efficacy Evaluation of 3D Cancer Spheroids Using an Imaging-Based Workflow
In drug evaluation using individual organisms such as humans and experimental animals, measurement values are affected by various factors such as age and growth environment, which makes it difficult to statistically analyze data from multiple samples.
3D cell culture models such as organoids and spheroids can closely mimic the in vivo structure and function of an organ or tissue and be mass-cultured in vitro. As a result, they are highly reproducible for statistical data analysis. Since 3D cell culture models are capable of replicating the cellular heterogeneity found in tumors, imaging of 3D cell-based assays is helpful for drug evaluation.
The workflow to evaluate drug efficacy using a 3D cell-based assay can be broken down into the following three processes (Figure 1):
- Prepare, culture, and treat the 3D cell culture model
- Acquire images of the cells
- Perform statistical analysis
This application note introduces an imaging-based workflow for each process. To demonstrate the workflow step by step, we used an assay to quantitatively evaluate the compound-induced damage to 3D cancer spheroids at the cellular level.
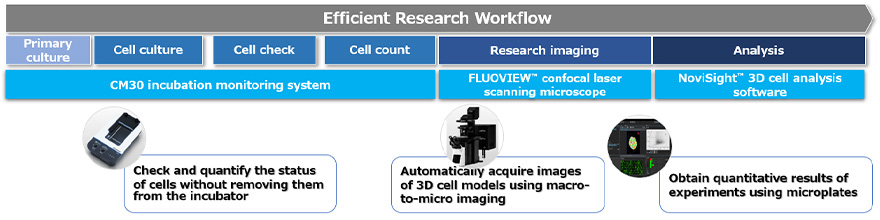
Figure 1. Imaging-based workflow for 3D cell culture models using technologies from Evident.
1.Preparation of the 3D cancer spheroids (pre-culture)
Cancer spheroids can closely mimic the cellular microenvironment found within in vivo tumors, so they are often used in screening assays for anticancer drugs. They are usually formed by culturing cancer cells in a hemispherical low-adhesion cell culture vessel.
To evaluate the drug efficacy, we prepared cancer spheroids of 600 µm or larger. For this process, we used the CM30 incubation monitoring system. This device enables long-term monitoring of cells and lets you track the status of cell cultures without removing them from the incubator.
To prepare the cancer spheroids, breast cancer-derived MCF-7 cells were seeded in U-shaped 96-well low-attachment vessels at a density of 2,000 cells/well. Immediately after seeding, we set the microplate in the CM30 system and placed the system in a CO2 incubator. By using the CM30 system, we could monitor how the dispersed MCF-7 cells formed spheroids and how their size increased over time (Figures 2).
Related VideosFigure 2. (a)Time-lapse images of the spheroid formation. |
(b) Image of the spheroid grown to the target size. A confluency mask shows the detected cells in blue. |
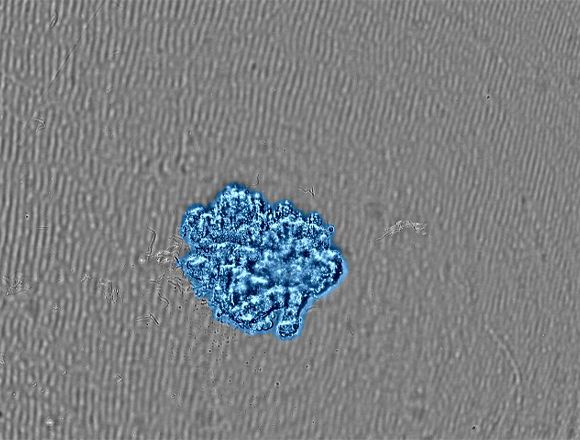
The CM30 system automatically recognized the spheroid area by applying the confluency measurement function. With the confluency measurement function, confluency is calculated as a ratio of the area occupied by cells compared to the area of the entire image. Figure 3 shows changes in the MCF-7 spheroid area over seven days.
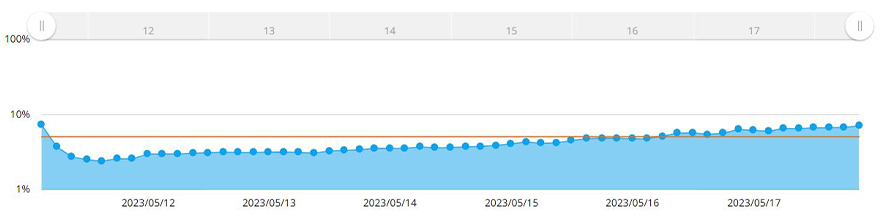
Figure 3. Graph showing the changes in size of the spheroid over seven days. The yellow line is the confluency target set in the system.
Once the confluency reached 5% of the acquired image area, the software measured the spheroid area. Here we determined that the diameter of the spheroid exceeds 600 µm when the confluency reaches 5%. Using the CM30 system, we set a target confluency of 5% in the software. An alert was generated when the cells reached or exceeded that confluency.
To check the alert worked correctly, we measured the spheroid size in 12 wells one day after the alert and confirmed that cancer spheroids with a diameter of 600 µm or more were obtained in all wells (Figure 4).
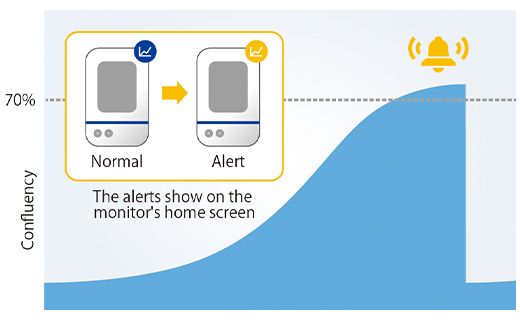 | 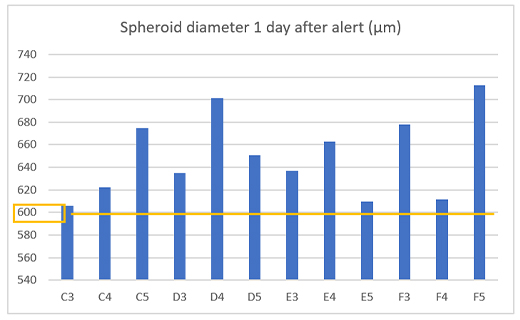 |
Figure4. Prepared spheroid size once day after the alert.
(a) Example of an alert on the CM30 system (b) Diameter of the prepared spheroids (n= 12).
Preparing the spheroids using the CM30 system enabled us to monitor the growth status without moving the container in and out of the incubator and without researcher involvement. In addition, the analysis software could quantify the spheroid size and alert us when the target spheroid size was reached. With the CM30 system implemented into your workflow, researchers have the freedom to complete other tasks with the time previously dedicated to monitoring cell culture.
Cancer spheroids exceeding a certain size were treated with one of three anticancer drugs (Cisplastin, Paclitaxel, or 5-FU) at different doses or a control. Hoechst 33342, Propidium Iodide (PI) and Calcein-AM were added to all wells 24 hours later. Hoechst 33342, PI, and Calcein-AM can stain the nuclei of all cells, nuclei of dead cells, and viable cells in spheroids, respectively. After staining, we acquired image data of the cancer spheroids using laser scanning microscopy.
2. Image acquisition of the cells in the 3D cancer spheroids
We used the FLUOVIEW™ FV3000 laser scanning confocal microscope to acquire high-resolution images of thick cancer spheroids at the single-cell level. The macro-to-micro imaging module on the FV3000 microscope made it possible to acquire images without having to search for the sample.
Figure 5 shows a schematic diagram of the automatic image acquisition process using the macro-to-micro imaging module. Cancer spheroids float at inconsistent positions within the U-shaped well. To address this, the macro-to-micro imaging module first records the position of the spheroid of interest by imaging the entire well at low magnification (macro image). After that, the module can automatically acquire only the spheroid region at high magnification (micro image). This process reduces the file size of the acquired image. It also helps to reduce the load on the system memory.
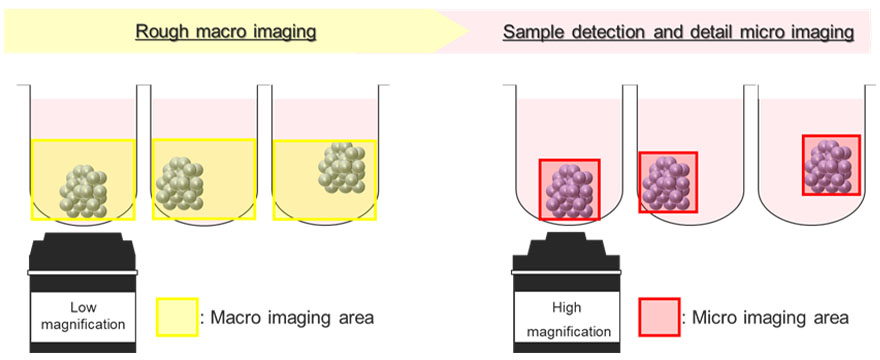
Figure 5. Schematic diagram of the macro-to-micro imaging module on the FV3000 confocal laser scanning microscope.
The microscope acquired consecutive Z-section images of cancer spheroids in 60 wells.
As shown in Figure 6, a high-resolution image of each cell in the cancer spheroid was acquired. A large number of PI-positive cells were visible in the Cisplatin-treated group relative to the control and two other cancer drugs, suggesting that this anticancer drug caused the death of these cells.
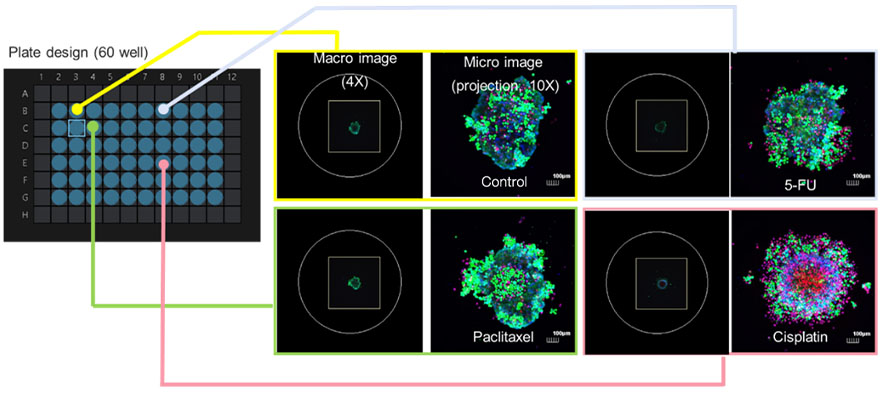
Figure 6. Images for determining cell life and death are automatically captured by the macro-to-micro imaging module.
3. Statistical analysis of the cells in 3D cancer spheroids
To determine the viability of each cell in the spheroid, we analyzed continuous Z-section images obtained from multiple wells using the NoviSight™ 3D cell analysis software. Hoechst 33342-derived fluorescence signals were used for recognition of all cell nuclei. Using a scatter-plot based gating process, cells with low intensity of fluorescence signal derived from Calcein-AM and high intensity of PI-derived signal were defined as dead cells. In contrast, cells with high Calcein-AM and low PI were defined as viable cells (Figure 7). We could then verify the validity of our classification using the gallery function. This demonstrated that by using NoviSight software, we could classify a large number of automatically recognized cells according to the intensity of the fluorescence signal.
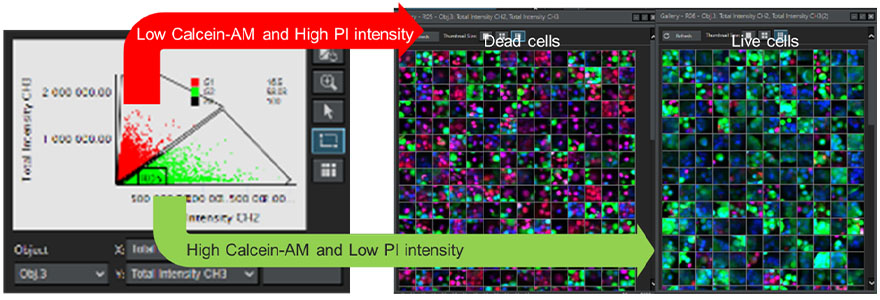
Figure 7. Determining the viability of all cells using NoviSight software. Left: Graph plotting the fluorescence signal intensity of the Calcein-AM channel and PI channel for each cell. Right: Gallery images of dead and live cells.
We calculated the percentage of viable cells in the spheroids treated with anticancer drugs, as shown in Figure 8. When Paclitaxel and 5-FU were added at different concentrations, we observed viable cells with no significant change in ratio. However, we confirmed a decrease in the ratio of viable cells as the concentration of added Cisplatin increased. NoviSight software facilitates imaging-based analysis of cell-based assays on 3D cell culture models to assess the efficacy of multiple drug candidates simultaneously.
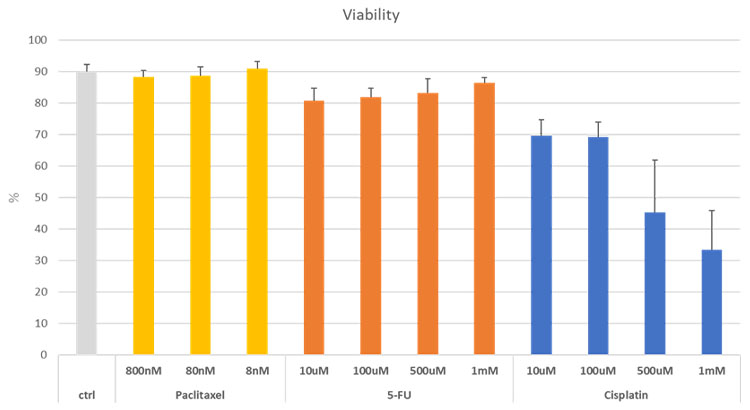
Figure 8. Changes in the ratio of viable cells in cancer spheroids with the addition of the anticancer drugs Paclitaxel, 5-FU, and Cisplatin.
Considerations for Evaluating the Effects of Anticancer Drugs on Cancer Spheroids
In this study, we confirmed how imaging-based solutions can aid in each step in the process to understand the effects of anticancer drugs on cancer spheroids at the cellular level.
Cancer spheroids are prepared through a laborious cell culture process. To quantitatively confirm the effects of anticancer drugs, spheroids must have homogeneous conditions (such as spheroid size in this study). Thanks to the CM30 system’s remote monitoring capabilities, we could check how cells proliferated until the spheroid reached a predetermined size without taking the culture out of the incubator. In addition, the alert function on the CM30 system helped us accurately time the treatment with anticancer drugs.
Laser scanning confocal microscopy is a suitable option for observing the response of cancer spheroids to anticancer drugs at the cellular level. Cancer spheroids cultured in U-bottomed wells are thought to exist near the center of the well. In reality, they are often located slightly off center. Imaging the entire well to capture the area with the cancer spheroids requires a large amount of storage data and is time consuming. The macro-to-micro imaging module of the FV3000 microscope simplifies this process. The module takes a low magnification image (macro image) of the entire well and automatically determines the optimal imaging position for high-magnification imaging (micro image). By only imaging the sample (cancer spheroids) at high magnification, the module reduces the image file size and time spent on imaging.
Images acquired with the FV3000 microscope can be seamlessly analyzed with NoviSight 3D cell analysis software. Statistical processing of viability signals at the cell level showed that the addition of Cisplastin increased the number of dead cells in a dose-dependent manner. NoviSight software can be used with analysis parameters such as signal intensity and cell position information to perform a more advanced analysis. By analyzing the behavior of each heterogeneous cell within a 3D spheroid, drug evaluation can be performed in an environment that closely mimics the cellular environment found in vivo.
This workflow uses technologies from Evident that can automate, shorten, and save time and effort in processes that users find difficult or complicated when analyzing 3D cell culture models. Combining the solutions provides a streamlined research workflow from start to finish.
Learn more about confocal imaging and image Analysis.
References
1)Elena M. Tosca et al., Replacement, Reduction, and Refinement of Animal Experiments in Anticancer Drug Development: The Contribution of 3D In Vitro Cancer Models in the Drug Efficacy Assessment. Biomedicines 2023, 11, 1058.
Author
Kazuhito Goda, Taro Hayashi, Research and Development, EVIDENT
Products related to this application
Sorry, this page is not
available in your country.