Spectral Bleed-Through Artifacts in Confocal Microscopy
Bleed-through (often termed crossover or crosstalk) of fluorescence emission, due to the very broad bandwidths and asymmetrical spectral profiles exhibited by many of the common fluorophores, is a fundamental problem that must be addressed in both widefield and laser scanning confocal fluorescence microscopy. The phenomenon is usually manifested by the emission of one fluorophore being detected in the photomultiplier channel or through the filter combination reserved for a second fluorophore. Bleed-through artifacts often complicate the interpretation of experimental results, particularly if subcellular co-localization of fluorophores is under investigation or quantitative measurements are necessary, such as in resonance energy transfer (FRET) and photobleaching (FRAP) studies.
Imaging specimens having two or more fluorescent labels (or plant tissue sections exhibiting a high degree of autofluorescence) is often complicated by the bleed-through or crossover of fluorescence emission, unless the spectral profiles of the fluorophores are very well separated. For example, when double labeling with the traditional green and red probes, fluorescein and rhodamine, bleed-through can only be reduced by using optimized fluorescence filter sets (and/or photomultiplier detector slit widths), but is never completely eliminated. This effect is due to the fact that these dyes have very broad absorption and emission spectra that exhibit a significant degree of overlap. Thus, excitation of fluorescein using a 488 nm laser will also produce excitation of rhodamine, although to a lesser degree. Furthermore, fluorescein emission will be detected in the photomultiplier channel or widefield filter set reserved for rhodamine.
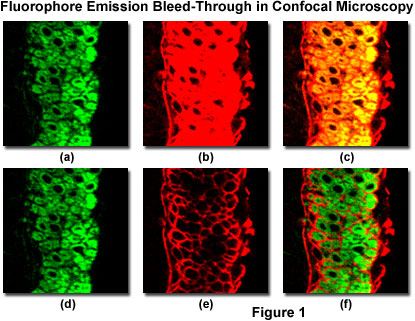
Spectral bleed-through in a thin section of mouse intestine labeled with Alexa Fluor 488 and Cy3 (a cyanine dye), and imaged with a laser scanning confocal microscope having adjustable photomultiplier detector slits is illustrated in Figure 1. These fluorophores exhibit absorption and emission spectra similar to fluorescein and rhodamine, although with slightly different peak wavelengths and somewhat narrower bandwidths. The pair of images illustrated in Figures 1(a) and 1(b) were obtained by simultaneous lateral scanning of the specimen using a 488 nm laser (Figure 1(a)) and a 543 nm laser (Figure 1(b)). Note the Alexa Fluor 488 fluorescence bleed-through apparent in the Cy3 detection channel (Figure 1(b)), which is manifested by yellow overlap regions in the final merged image (Figure 1(c)). This artifact can be easily confused with co-localization of the fluorophores. By sequentially scanning the specimen with the individual lasers and detecting fluorescence in each channel to coincide with laser illumination (Figure 1(d) and 1(e); discussed in more detail below), spectral bleed-through is minimized (compare Figure 1(c) to Figure 1(f)) to produce a more accurate merged image of fluorophore distribution.
The Alexa Fluor 488 detection channel (see Figures 1(a) and 1(d)) photomultiplier slit has been set to a 30-nanometer bandwidth (ranging from 500 to 530 nanometers) that encompasses the primary probe emission peak, but does not capture a significant amount of fluorescence from Cy3 emission. As a result, the Alexa Fluor 488 channel does not detect Cy3 fluorescence emission at normal voltage and gain settings, regardless of whether the instrument is scanning simultaneously or sequentially. In contrast, to capture sufficient fluorescence emission from the cyanine dye, the Cy3 detection channel photomultiplier slit must be set to a wider range (555 to 625 nanometers), which also allows the longer wavelengths of Alexa Fluor 488 emission to register on the detector. Thus, adjusting the detector slits (or interference filters) alone will not adequately reduce bleed-through with fluorophores having this high degree of spectral overlap. In many cases, bleed-through can be controlled by judicious choice of fluorophores having well-separated absorption and emission spectra. Substituting Alexa Fluor 568 for Cy3 in this instance (a 35-nanometer difference in emission peak wavelength) would lead to slightly less efficient excitation with the 543 nm laser, but would significantly reduce bleed-through.
A comparison of spectral overlap for a series of Alexa Fluor dye combinations potentially useful in dual color labeling experiments is presented in Figure 2. All of the emission spectra are normalized for comparison, and the overlap regions are indicated by gray shading. In Figure 2(a), the emission spectra for the green fluorescent Alexa Fluor 488 and yellow-orange fluorescent Alexa Fluor 555 indicate clear separation of the peak wavelengths, which are also easily distinguished by the human eye. However, the moderate level of spectral overlap (gray shaded area) illustrates that there is a considerable amount of emission from Alexa Fluor 488 at the peak emission wavelength of Alexa Fluor 555 (denoted by a black line running from the emission peak to the abscissa). This high level of signal bleed-through renders separation of the probes difficult in situations where the fluorescence emission intensity of Alexa Fluor 488 is significantly greater than that of Alexa Fluor 555, which can occur due to a number of factors including large differences in label target population. These probes are efficiently excited by the 488 nm and 543 nm/561 nm lasers.
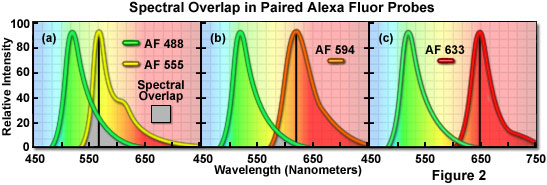
The spectral overlap between Alexa Fluor probes decreases as the bandwidth between emission maxima increases, as illustrated in Figure 2(b). In this case, Alexa Fluor 488 and orange fluorescent Alexa Fluor 594 demonstrate a reduced level of overlap when compared to Figure 2(a). Both dyes are easily distinguishable to the human eye and the low degree of spectral overlap should yield good results with minimal bleed-through in dual labeling experiments, provided the concentrations of each probe are similar in the specimen. Alexa Fluor 594 is most efficiently excited by a 561nm diode laser or a 594nm diode laser. Perhaps the best spectral separation in visible-light emitting Alexa Fluor dyes is the comparison between Alexa Fluor 488 and Alexa Fluor 633 depicted in Figure 2(c). There is virtually no spectral overlap between these dyes and bleed-through artifacts should be absent, even in specimens containing excessive levels Alexa Fluor 488. The Alexa Fluor 633 probe is efficiently excited by a 640 nm laser diode.
In describing spectral overlap artifacts, the terms bleed-through, crossover, and crosstalk are often used interchangeably. Although bleed-through and crossover refer to the spillover of fluorescence emission (or excitation) from one filter set or photomultiplier detection channel into another, crosstalk is widely employed in the filter industry to describe the minimum attenuation level of two filters placed together in series. The crosstalk value of a fixed filter combination is important for manufacturers when matching fluorescence excitation, emission, and dichromatic beamsplitter filters in a set, but is somewhat different from spectral bleed-through in confocal microscopy. Therefore, care should be used in selecting a term to describe the overlap of fluorescence emission from one detector channel into another, and the investigator should be aware of differences in terminology.
Spectral crossover can occur during both excitation and emission of the synthetic fluorophores and fluorescent proteins commonly utilized in confocal microscopy. In general, crossover between fluorophore absorption (or excitation) spectral profiles occurs toward the blue end (shorter wavelengths) of the spectrum, whereas crossover between fluorescence emission spectra occurs in the red (longer wavelengths) region. For example, emission from a green fluorophore can often be detected through red emission filters, but a red dye is only seldom imaged through a green emission filter. This is due to the fact that the absorption and emission spectra for most dyes are not symmetrical, but usually display long, skewed tails that cover regions of tens to hundreds of nanometers. Absorption spectra are generally skewed towards shorter wavelengths whereas emission spectra are skewed towards longer wavelengths. For this reason, multicolor fluorescence imaging should be conducted with the reddest (longest wavelength peak emission) dye imaged first, using excitation wavelengths that are only minimally absorbed by the skewed spectral tails of the bluer dyes.
Specimen Labeling Precautions to Reduce Bleed-Through
For determining the physical and spatial location, as well as association between biomolecules and subcellular structures of interest, labeling specimens with two or more probes is a highly effective technique in fluorescence microscopy. In this regard, confocal microscopy (when using two or more lasers) is well-suited to multiple labeling techniques because of the ability to differentiate between fluorescence emission spectra of individual fluorophores by directing the signals to several detection channels. There are, however, numerous limitations that must be considered when performing multiple labeling experiments, either with confocal or traditional widefield fluorescence microscopy.
The fluorescence emission spectral profiles of common fluorophores differ significantly with regards to bandwidth, peak emission wavelength, symmetry, and number of maxima. In multi-labeled specimens, if the degree of labeling and the intensity of fluorescence emission from the fluorophores is not equally balanced, brighter signals can overwhelm and penetrate the barrier filters of channels reserved for weaker fluorophores or those with less abundant targets. The result is too often a significant contribution from the overstained fluorophore to the image recorded in the channel reserved for a lower intensity probe. The fluorescence intensity from probes such as fluorescein and rhodamine (as well as their relatives) should be similar and are adjusted according to the quantity of dye in the specimen and the illumination source.
Careful balancing of fluorophore emission cannot be overemphasized during specimen preparation. During imaging, the apparent balance can be adjusted by altering the gain, photomultiplier voltage, or laser power for the individual detection channels in confocal microscopy. However, simply balancing the amount and color of the fluorophore with target abundance during specimen preparation will alleviate many problems when imaging and, in general, lead to superior images. This concept is illustrated in Figure 3 for a dual label situation using fluorescein and rhodamine (only the fluorescence emission spectra are presented). Each detection channel window is outlined with a colored box in Figure 3, with the fluorescein channel collecting signal between 490 and 555 nanometers (red box) and the rhodamine channel set to a range of 570 to 665 nanometers (blue box). Note that the rhodamine channel has a significantly wider bandwidth in order to gather signal from the skewed long-wavelength tail region of the emission spectrum.
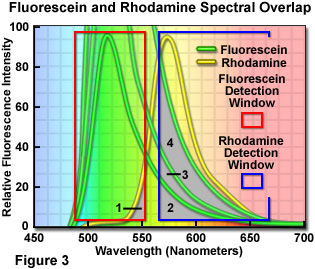
If the fluorophore concentrations are balanced such that both fluorophores produce similar emission intensities, then the amount of bleed-through from one channel into another is shown as the gray overlap areas labeled 1 and 2 in Figure 3. Clearly, a significantly higher level of the fluorescein emission crosses into the rhodamine channel than vice versa. The degree of bleed-through could be reduced, in this case, by decreasing the concentration of fluorescein while maintaining that of rhodamine constant. In situations where the level of fluorescein labeling greatly exceeds that of rhodamine, the amount of bleed-through becomes more severe, as illustrated by the increasing overlap in areas labeled 3 and 4 (note that the concentration of fluorescein is doubled and quadrupled, respectively). At the highest fluorescein concentration illustrated in Figure 3, the amount of bleed-through emission (area 4) collected in the rhodamine channel almost equals that of the target fluorophore emission itself.
When selecting fluorescent probes for multi-labeled specimens, the brightest and most photostable fluorophores should be reserved for the least abundant cellular targets. In general, dyes with green and red fluorescence emission tend to be brighter than those emitting in the blue and far-red portions of the spectrum. However, even when probe concentrations are carefully controlled with regards to quantum yield, photostability, illumination source, and target abundance, the level of signal crossover and bleed-through generally remains between 10 and 15 percent unless the emission spectral maxima are separated by 100 to 150 nanometers or more. Furthermore, the localized environment significantly influences fluorophore absorption and emission spectral profiles, so the spectra published by manufacturers of isolated fluorophores in solution can differ markedly from those observed under actual experimental conditions. In experiments involving two or more fluorophores, the investigator should always examine single-stained control specimens using the filter sets for the other fluorophores to assure that the level of bleed-through is minimal. In many cases, the primary cause of bleed-through is unequal staining by the fluorophores, which should be corrected by altering the staining protocol rather than adjusting exposure times in the microscope or performing extensive image rehabilitation with post-acquisition processing.
Instrumental Approaches to Fluorophore Emission Separation
The traditional fluorescein and rhodamine fluorophores, along with their Alexa Fluor and cyanine dye relatives, are popular combinations for dual labeling in both widefield and confocal fluorescence microscopy. In fact, the fluorescein and rhodamine probes have been so widely used that most microscope and aftermarket filter manufacturers have specialized filter sets named after their reactive isothiocyanate intermediates (FITC and TRITC, respectively). Widefield microscopes equipped with LED light sources generally excite these fluorophores using the 470 and 550-nanometer spectral peaks, while confocal microscopes employ 488 nm and 543 nm/561 nm diode lasers, respectively.
Choosing two or more fluorophores for simultaneous excitation by a single laser wavelength places severe restrictions on the experimental parameters. The fluorophore absorption spectra must overlap significantly to permit simultaneous excitation, but for most combinations, one fluorophore will be excited to a much higher degree than the others. In addition, the emission spectra should have a minimum degree of overlap in order for the signal from each fluorophore to be effectively separated with carefully chosen bandpass filters. Furthermore, the emission spectra of the fluorophores having the shortest excitation wavelengths should not overlap with the absorption spectra of other fluorophores to avoid energy transfer artifacts. Due to these strict requirements, and the general lack of suitable fluorophores, most investigators choose confocal microscopes with two or more lasers for multiple labeling experiments.
Both widefield and confocal microscopes use filters constructed of coated glass or multiple thin-film interference layers to separate fluorescence emission signals. In these instruments, a dichromatic beamsplitter diverts light into two pathways, one reflected onto the specimen and the other transmitted to the detector. A bandpass barrier or emission filter refines light transmitted by the beamsplitter before it is gathered by the detector, either a charge-coupled device (CCD) or photomultiplier. The dichromatic mirror and barrier filter perform the functions of limiting excitation light from reaching the detector and collecting the maximum amount emission signal from a single fluorophore without allowing emission from other fluorophores to contaminate the signal. Thus, the separation of fluorescence emission is highly dependent upon filter characteristics. Well-spaced and/or excessively broad emission spectral profiles can take advantage of wide bandpass emission filters covering a hundred nanometers or more, and produce bright images due to the high levels of fluorescence signal passing through the filter. These high signal levels can be controlled through the use of neutral density filters in widefield fluorescence or by reducing laser power in confocal microscopy. In contrast, closely overlapping emission spectral profiles require very narrow bandpass filters for optimum separation, but at the cost of lower signal levels.
The major disadvantage of using filter sets to detect fluorescence emission is that all photons collected by a filter are treated in the same manner, regardless of source. Transmission of unwanted wavelengths through a typical filter set is generally about 10 percent of the total number of photons passing through. In order to combat this dilemma, confocal manufacturers are developing multispectral instruments that are capable of distinguishing the source of fluorescence emission based on the spectral profiles of the individual fluorophores (a technique often referred to as emission fingerprinting). These advanced instrumental designs, which will probably become the workhorses of modern confocal microscopy, utilize one or more of several available options to discriminate between emission in experiments where it is not possible or feasible to choose non-overlapping fluorescent probes. The simplest approach in multispectral imaging is to dissect fluorescence emission into its component wavelengths with a finely lined dispersion grating and limit collection to specific regions using a movable slit. A second method uses a prism or acousto-optic deflector instead of the dispersion grating to perform the same function, while a third design couples the dispersion grating to a multi-channel photomultiplier that collects a series of narrow (10-nanometer) wavelength bands. Each multispectral microscope configuration has its advantages and limitations, but all three are capable of wavelength discrimination down to a resolution of only a few nanometers.
Multispectral confocal microscopy is the method of choice when imaging multiple fluorescent protein variants in a single experiment or when naturally occurring and fixative-induced fluorescence (usually collectively termed autofluorescence) masks the signals of target fluorophores. Autofluorescence and other forms of unwanted emission signal often cross over into several channels, a factor that can complicate quantitative analysis. Furthermore, when four or more fluorophores are used in a single experiment, a significant degree of spectral overlap, along with the resulting bleed-through artifacts, is inevitable. In this case, multispectral imaging is one of the most promising techniques for eliminating bleed-through. Among the drawbacks of multispectral imaging is the reduction in signal that accompanies the narrow detection windows often required for separation of fluorescence emission. An alternate instrumental approache to eliminate bleed-through (termed fluorescence lifetime imaging microscopy, or FLIM) is based on gating fluorescence output in lifetime studies where fluorophores with similar spectral profiles can be distinguished due to their individual decay characteristics.
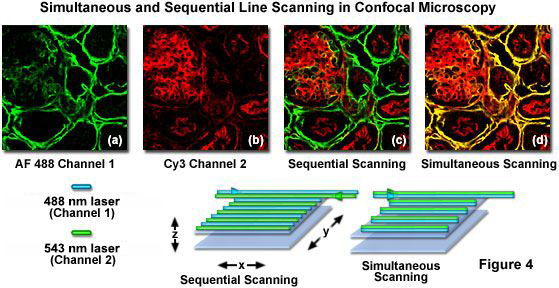
Confocal microscopes equipped with acousto-optic tunable filters (AOTFs) or similar rapid laser line switching devices can be effectively utilized to sequentially scan specimens using a technique known as high-speed channel switching or multitracking. This approach enables the sequential excitation and collection of emission from individual fluorophores in order to reduce or eliminate bleed-through, but does not solve the problem when both emission and absorption spectra overlap extensively. In practice, the rapid switching of laser lines, either individually or for the entire frame, is coupled to serial detection by each channel as its target fluorophore is stimulated (see Figure 4). For the example illustrated in Figure 4, using Alexa Fluor 488 and Cy3, the 488-nanometer laser line employed to excite Alexa Fluor 488 is turned on as the laser scans across the line in the x-direction while simultaneously collecting Alexa Fluor 488 emission using the appropriate filter set for the channel detector. On the return path, the 488-nanometer line is turned off and the Cy3 probe in the specimen is excited with the 543-nanometer laser line, again collecting only fluorescence emission using a Cy3-compatible filter set for the second channel detector. This scanning sequence avoids exciting both fluorophores simultaneously and is an effective method to control bleed-through, particularly when the choice of emission filters is limited.
Sequential frame scanning with the concurrent collection of fluorescence signal for each individual channel is an excellent method to generate very nice images with fixed specimens that are immobilized. However, when collecting images from living cells that have been labeled with two or more fluorophores, even a small degree of motion by subcellular structures will compromise the images and decrease the accuracy of co-localization investigations. Therefore, for live-cell investigations it is more prudent to use fast multitrack line scanning to rapidly switch between individual laser lines, collecting image information for each channel one line at a time as the frame is being recorded.
Bleed-Through in Fluorescent Proteins
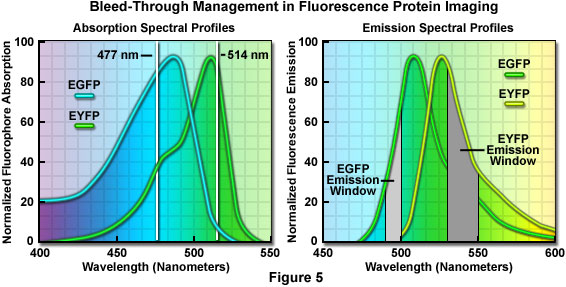
Fluorescent proteins, which are widely available in emission wavelengths ranging from blue to the far red, are very effective for live-cell imaging studies using confocal microscopy, albeit with some trade-offs. For example, the rate of data acquisition is reduced when more than two species are employed in an experiment, and each fluorescent protein usually requires substantially different image collection conditions. Addressing spectral bleed-through is often far more complicated with fluorescent proteins than traditional synthetic probes, especially because the emission spectra of the former tend to be quite broad. In addition, because different fluorescent proteins vary in relative brightness, each color may require different signal integration times. The enhanced cyan and blue varieties (ECFP and EBFP) are very dim compared to green and yellow fluorescent proteins, requiring longer collection times that saturate the brighter fluorophores. Thus, when using fluorescent proteins, the experimental requirements must be balanced with the choice of fluorophore to determine combinations that have similar emission intensities with well-separated spectral characteristics.
Some of the brightest fluorescent proteins are green and yellow, but successful discrimination between these species is often hampered by the fact that their spectral peaks are separated by only 25 nanometers. Dual or multicolor experiments using the green and yellow fluorescent combination are possible, but bleed-through between filter sets and/or the necessity to radically reduce detection slit bandwidths presents a significant problem. More commonly, yellow fluorescent protein is coupled with cyan fluorescent protein for dual color imaging experiments. Although cyan fluorescent protein is not much brighter than the blue species, it has two advantages in that it can be excited with a 445nm laser, and is much more resistant to photobleaching than blue fluorescent proteins.
Combinations of DsRed with green or yellow fluorescent proteins also yield adequate spectral separation, but biological artifacts, such as slow maturation and aggregate formation, often complicate studies with red fluorescent protein species. Second-generation red fluorescent proteins have solved the biological problems to produce excellent candidates for multi-labeling experiments. Many fluorescent proteins with emission profiles extending into the far red and near-infrared are available, enabling researchers to take advantage of the red 640-nanometer diode laser line. Further spectral separation can be achieved by using even further-shifted red dyes in combination with near-IR diode lasers such as 730-nanometer and 785-nm lasers. Examples of popular far-red dyes include Cyanine7, Alexa Fluor 750, Alex Fluor 790, and Indocyanine Green (ICG).
Quantum Dots
Quantum dots, which are semiconductor nanocrystals coated with a hydrophilic polymer shell and conjugated to antibodies or other biologically active moieties, enjoy several advantages not shared by most traditional fluorophores. Unlike typical organic fluorochromes or fluorescent proteins, which display highly defined spectral profiles, quantum dots have an absorption spectrum that increases steadily with decreasing wavelength. Also in contrast, the fluorescence emission intensity is confined to a symmetrical peak with a maximum wavelength that is dependent on the dot size, but independent of the excitation wavelength. As a result, the same emission profile is observed regardless of whether the quantum dot is excited at 300, 400, 500, or 600 nanometers, but the fluorescence intensity increases dramatically at shorter excitation wavelengths. For example, the extinction coefficient for a typical quantum dot conjugate that emits in the orange region (605 nanometers) is approximately 5-fold higher when the semiconductor is excited at 400 versus 600 nanometers. The full width at half maximum value for a typical quantum dot conjugate is about 30 nanometers, and the spectral profile is not skewed towards the longer wavelengths (having higher intensity "tails"), such is the case with most organic fluorochromes. The narrow emission profile enables several quantum dot conjugates to be simultaneously observed with a minimal level of bleed-through.
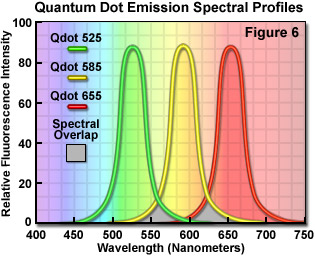
In confocal microscopy, quantum dots are excited with varying degrees of efficiency by most of the laser lines. Particularly effective at exciting quantum dots in the ultraviolet and violet regions are the blue diode lasers that have prominent spectral lines at 445 nanometers and below. The 405-nanometer blue diode laser is a common excitation source that is very effective for use with quantum dots due to their high extinction coefficient at this wavelength. Another advantage of using these fluorophores in confocal microscopy is the ability to stimulate multiple quantum dot sizes (and spectral colors) in the same specimen with a single excitation wavelength, making these probes excellent candidates for multiple labeling experiments. Quantum dots are available with emission maxima extending from 525 to 705 nanometers in 20 to 40-nanometer increments, and a near-infrared probe having an emission peak centered at 800 nanometers. By carefully choosing the appropriate quantum dot combination (for example, 525, 585, and 655; see Figure 6), confocal experiments can be conducted with a single laser and dramatically reduced bleed-through artifacts when compared to traditional fluorophores.
Bleed-Through Correction
Because the number of fluorescent signals in multi-labeling experiments can easily exceed the discrimination capabilities of the detection system, regardless of the instrument sophistication level, post-acquisition image processing is often the only alternative to bleed-through correction. A series of control specimens should be prepared when conducting multiple labeling with two or more fluorophores in order to minimize the confusion in experimental results due to bleed-through artifacts. The most important controls are preparing the specimen without secondary antibodies or synthetic fluorophores (the background control) and labeling the specimen with each fluorophore separately (the bleed-through controls). The background control should be examined independently with each laser and detection channel to set the limits of signal gain and offset that should be employed for the final imaging series. All channels that will be used to image a multi-labeled specimen must be subjected to an independent background correction because the level of autofluorescence in each channel can vary substantially. Generally, autofluorescence is greater for shorter excitation wavelengths, such as those emitted by ultraviolet, 405-nanometer, and 488-nanometer lasers. The green, yellow, orange, and red laser channels are far less prone to suffer autofluorescence artifacts.
The bleed-through controls are necessary to determine the amount of signal gain possible in each channel without initiating bleed-through into adjacent channels. For example, when examining dual-labeled specimens fluorescein and rhodamine, specimens containing both fluorescein and rhodamine alone should be prepared. To establish the level of bleed-through, the fluorescein control is imaged with an argon-ion 488-nanometer laser under optimum conditions and the amount of signal present in the rhodamine channel recorded (note there is no rhodamine dye in the specimen). This signal represents fluorescein bleed-through combined with background autofluorescence. The procedure is repeated with the rhodamine control, this time exciting with the 543 nm/561 nm line and examining bleed-through into the fluorescein channel.
This approach to bleed-through correction requires that the relationship between fluorescence emission intensity and fluorophore concentration be constant for all pixels in the image. The photomultipliers used for confocal microscopy exhibit good linearity when imaging at a single wavelength, but large changes in the observed signal levels can be obtained with individual channels due to the highly nonlinear relationship between photomultiplier quantum efficiency and wavelength of the detected light (especially in the extremes of the response curve). In addition, the influence of localized environmental variables and photobleaching in the region being examined must be taken into consideration. Shifts in the emission spectra wavelength profile of fluorophores, although unlikely with most of the popular probes, will affect the relative distribution of fluorescence signal acquired between the detectors.
Once the appropriate controls have been prepared and analyzed, it is possible to estimate the amount of signal bleed-through that is likely to occur when fluorophore pairs in the target specimen are imaged. As discussed above, even with filter bandwidth optimization, a portion of the fluorescein emission will bleed into the rhodamine channel and some of the rhodamine emission will bleed into the fluorescein channel, although rhodamine bleed-through will be much less than that observed with fluorescein. Several commercial software packages are available to process bleed-through data using linear unmixing algorithms, and confocal microscope manufacturers often bundle similar software with their instruments. This software can apply the simultaneous linear equation correction algorithms for each pixel in the image to determine the amount of bleed-through based on the ratio of intensities recorded with the specimen and controls.
Spectral bleed-through artifacts are easily confused with resonance energy transfer, co-localization, and non-specific background staining. If the emission spectrum of one fluorophore overlaps significantly with the absorption spectrum of a second probe, then regions where the two fluorophores are co-localized may undergo resonance energy transfer. Bleed-through can be distinguished from resonance energy transfer by performing control measurements, as described above, for specimens labeled with the individual fluorophores alone. Resonance energy transfer can be observed (after bleed-through correction) by exciting the fluorophore with the lowest absorption maxima, and then detecting signal in the channel of the fluorophore whose emission spectrum overlaps with the excited probe. As an example using fluorescein and rhodamine, after exciting fluorescein with the 488-nanometer laser, fluorescence is monitored in the rhodamine channel. Any signal recorded in the rhodamine channel could be due to resonance energy transfer, but only in regions where the two probes are co-localized.
Conclusions
In summary, the best fluorophores for confocal or widefield fluorescence microscopy have absorption maxima that closely match the laser or LED spectral lines utilized to excite the probe. Choosing fluorophores with the highest quantum yields for the least abundant targets will assist in balancing overall fluorescence emission. In addition, probes with narrow emission spectra may dramatically reduce the problem of bleed-through, but will not eliminate it altogether. The optical filter sets chosen to examine fluorophore emission should be closely matched to the spectral profiles of the probe with regards to bandwidth size and location. Also, interference filter blocking levels often vary by manufacturer and should be checked to ensure that unwanted fluorescence emission is excluded by the filter set used for imaging.
Modern synthetic fluorophores exhibit dramatically reduced susceptibility to photobleaching, which allows longer integration periods with CCD cameras or photon collection times with reduced laser power in confocal microscopy. This results in higher quality images and far less cell damage during live-cell imaging experiments. In contrast to synthetic fluorophores, modern fluorescent proteins are more photostable than previous versions, and far more likely to not disrupt cellular metabolic processes than synthetic probes. However, it should be noted that all fluorophores have the potential to affect cell behavior to some extent, especially if the chemical and physical characteristics of the probe are significantly altered by environmental variables, such as ion concentration, pH, and hydrophobicity.
Regardless of the fluorophore physical characteristics, a high degree of target specificity is necessary to obtain suitable signal levels and reduce bleed-through artifacts, especially with secondary antibodies in immunofluorescence preparations. Even a small amount of non-specific labeling will produce a high degree of background that both degrades the specimen image and confuses quantitative interpretation. Many of the probes designed to highlight subcellular structures (such as the Golgi complex or mitochondria) have a relatively low level of specificity, but are still useful because of the known geometry of these organelles.
As manufacturers develop more advanced fluorophores and expand diode laser lines throughout the visible and near-infrared regions, the choice of probes for multiple labeling experiments in confocal and widefield fluorescence microscopy without bleed-through artifacts will become easier. For example, confocal microscopes equipped with a 405-nanometer diode laser, a 514-nanometer diode laser, and a 640-nanometer red diode laser can excite fluorophores with emission spectra having wavelength maxima separated by over 100 nanometers, thus minimizing the potential for bleed-through. In addition, new fluorescent proteins with emission spectral profiles in the far red and infrared will require red-shifted laser lines that are less damaging to cellular metabolic processes than violet, blue, and green systems.
このページはお住まいの地域ではご覧いただくことはできません。