In black and white photography through the microscope, filters are used primarily to control contrast in the final image captured on film. Specimens that are highly differentiated with respect to colored elements from biological stains are translated into shades of gray on black and white film and will often appear to have equal brightness. When this occurs, important specimen details may be lost through a lack of contrast. Filtration techniques for black and white film are significantly different from those employed in color photomicrography.
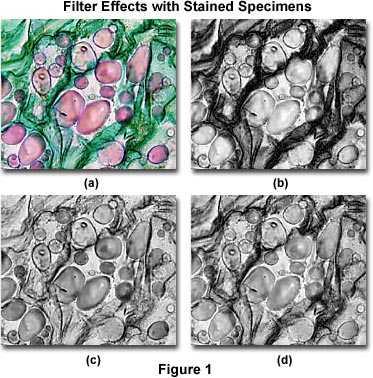
To better image specimens using black and white photomicrography, filters are usually employed to selectively absorb one or several colors, especially when using panchromatic films that have equal sensitivity to more than one stain color. Many stained biological specimens exhibit very pale colors against a bright background (using brightfield transmitted light microscopy), which will appear as light gray tones on a white background when recorded on black and white film. To enhance contrast, a color filter is added to the microscope light path that absorbs the stained specimen color, rendering it a darker gray. Contrast can be adjusted in this manner by selectively choosing filters that absorb varying amounts of the stain color. This concept is explored with the photomicrographs presented in Figure 1, which illustrate a thin section of Solanum tuberosum (potato) stained with a quadruple stain mixture containing Safranin O (stains nuclei, chromosomes, lignified and cutinized cell walls red), Fast Green (stains cytoplasm and cellulose cell walls green), Crystal Violet (stains starch grains purple), and Orange G (stains acidophilic cytoplasm and cell walls yellow to green).
The photomicrograph illustrated in Figure 1(a) was taken with brightfield illumination and neutral density filters using Fujichrome 64T color transparency (reversal) film. This image shows starch grains in the tuber matrix stained predominantly with Safranin O and Crystal Violet, while the remainder of the specimen consists of cellulose and cell walls stained green with Fast Green and Orange G. Figure 1(b) shows the same field photographed using Kodak T-Max 100 (a continuous-tone panchromatic black-and-white negative film), but with a Kodak Wratten number 25 red filter (see Table 2) inserted into the microscope light path. Red areas of the specimen are reduced in contrast by the filter, which also introduces too much contrast in specimen details that are stained blue and green.
Filter Control of Specimen Contrast in Black & White Photomicrography
Explore how various filter combinations can be used to adjust specimen contrast in black and white photomicrographs.
A Kodak number 47B blue filter was placed into the microscope light path to record the photomicrograph illustrated in Figure 1(c). With this filter, the starch grains have acquired enhanced contrast, but green areas of the specimen are losing both contrast and detail. Figure 1(d) illustrates the specimen when a Kodak number 58 filter (green) is placed into the light path. This green filter increases contrast of the starch grains when compared to Figure 1(b), but decreases contrast in areas stained with the green dyes. Overall contrast is optimized with the photomicrograph presented in Figure 1(d).
As a general rule when employing color filters in black and white photomicrography, utilize filters that are complimentary to specimen stain color (they absorb most of the predominant wavelengths transmitted by the stain) to maximize the amount of contrast in final images. To achieve a medium level of contrast, use filters that only partially absorb colors displayed by features of interest. Finally, to reduce contrast to a minimum, use filters that have colors identical to those of the specimen. A combination of filters can be used to enhance detail contrast in specimens stained with more than one color.
Absorption Characteristics for Biological Stains
| Stain | Visible Light Absorption Range |
|---|---|
| Acid Fuchsin | 530-560 |
| Aniline Blue | 550-620 |
| Azure B | 580+ |
| Azure C | 580-640 |
| Basic Fuchsin | 520-570 |
| Brilliant Cresyl Blue | 550+ |
| Carmine | 500-570 |
| Congo Red | 400-560 |
| Crystal Violet | 550-610 |
| Darrow Red | 450-550 |
| Eosin Y | 490-530 |
| Erythrosin B | 510-540 |
| Ethyl Eosin | 530-550 |
| Fast Green | 560+ |
| Giemsa | 500+ |
| Light Green SF | 590+ |
| Luxol Fast Blue | 500-640 |
| Methyl Green | 560+ |
| Methylene Blue | 590+ |
| Neutral Red | 480-570 |
| Nigrosin | 450+ |
| Nuclear Fast Red | 460-550 |
| Orange G | 450-510 |
| Orecin | 500-620 |
| Phloxine B | 510-560 |
| Prussian Blue | 560+ |
| Pyronin B | 510-560 |
| Saffron | 350-480 |
| Safranin O | 470-550 |
| Sudan IV | 470-580 |
| Sudan Red | 450-590 |
| Tartazine | 400-460 |
| Toluidine Blue | 560+ |
| Trypan Blue | 500+ |
| Wright's | 500+ |
Table 1
Table 1 can be viewed as a compilation of bar charts representing the absorption spectra of common biological stains.
Most biological specimens lack sufficient color and contrast to be readily imaged in the optical microscope using brightfield illumination. These specimens do not usually absorb visible light to any great extent (they are not good amplitude specimens) and can be seen as a rough outline with some internal detail only when the condenser aperture size is reduced, often to the point of introducing optical artifacts. To circumvent this problem, microscopists often treat biological cells and tissues with reactive organic dyes that will selectively stain and color various portions of the biological architecture. Because the background often appears white or very light gray in brightfield microscopy, the stained tissue will appear colored and superimposed over a light background. This is often sufficient to render the details of interest visible and with enough contrast to provide good photomicrographs.
In many instances, two or more stains of different color are combined to help differentiate between cellular elements that lie close together, producing a color contrast that separates one element from another. For example, cell nuclei can be stained with Hematoxylin, a natural leuco compound extracted from chipped logwood, which selectively binds to chromatin. To provide contrast, Hematoxylin is often combined with Eosin, a red fluorescein dye that stains a variety of cytoplasmic structures. The combination of these two stains renders cells with nuclei stained a deep blue and having cytoplasmic components that are stained red.
Procedures for staining biological tissue range from very simple mixtures of single cells with dye, to complex multi-step tissue sectioning processes that consume a considerable amount of time and materials. Smears can often be stained by simply dropping a mixture of stain and fixative into a culture tube containing the cells to be examined. Tissue sections are more difficult, and require several fixative and sectioning steps prior to being placed onto microscope slides and run through a gamut of stain and wash solutions.
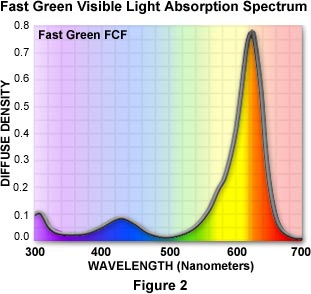
Most stains are complex heterocyclic organic dyes that are obtained either naturally or are synthesized in the laboratory. Dyes are characterized by their ultraviolet and visible absorption spectra, which are used to differentiate one stain from another. A typical visible light absorption spectrum for the triphenylmethane dye Fast Green is illustrated in Figure 2. A strong absorption band centered at 620 nanometers filters out most of the red wavelengths leaving only green and blue. Fast Green is a negatively charged (anionic) dye used to selectively stain collagen, mucus, and plant cell walls, rendering these structures a blue-green to deep green in color. Clearly, the absorption characteristics of the stain must be considered when using organic dyes to color biological tissue.
Stain selectivity is determined by the chemical and electronic properties of the dye molecules with respect to their interaction with cellular components. Stains that have a net positive charge in aqueous or buffered solutions will selectively attach or bind to biological structures that have a negative charge. Hydrophilic stains will tend to stain hydrated biological assemblies such as the exterior of proteins and nucleic acids. Stains with hydrophobic character will partition into membranes, lipids, and the interior of proteins. These properties should be borne in mind when selecting stains for biological tissues.
A compilation of common biological stains along with their visible light absorption properties is presented in Table 1. Dyes used by microscopists to stain biological tissue have a wide spectrum of colors, ranging from deep blue to bright red, with a myriad of intermediate colors also available. After examining the table, it will become evident that many dyes have similar spectral properties and, at first glance, it would seem that similar dyes can be used interchangeably to stain biological specimens. In many situations, similar dyes can be substituted without adverse affects, but in some cases substitute dyes can interact with other dyes or biological structures in unforeseen ways to yield less than desirable results. This is common in complex stain mixtures where the chemical and physical properties of dyes must be finely tuned and matched to each other. Often, substitution of one dye for another dramatically changes the staining properties of the mixture.
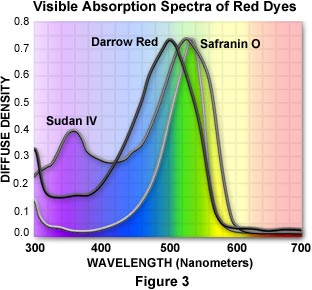
As mentioned above, many dyes have similar colors and spectral properties. However, upon close examination of their visible absorption spectra, dyes that appear similar often vary markedly in their light absorption profiles. As an example, we can compare three red dyes that appear to have identical or nearly identical spectral characteristics: Darrow Red, Safranin O, and Sudan IV. Visible light absorption spectra for the three dyes are illustrated in Figure 3. Although all three dyes absorb strongly in the 430 to 580 nanometer (blue-green) region and transmit red wavelengths, their principal absorption maxima differ by as much as 40 nanometers. The spectral widths and distributions of wavelengths absorbed also differ throughout the three spectra. Darrow red strongly absorbs wavelengths in the 400 to 460 nanometer range, but Safranin O has little absorption in this region. The absorption spectrum of Safranin O is also shifted 20 nanometers towards longer wavelengths in the 580-600 nanometer region.
The electronic, chemical, and physical properties of the three dyes vary even more than the absorption spectra. Safranin O is very water soluble, but the other two dyes are only sparingly soluble in aqueous or buffered solution. In addition, Darrow Red and Safranin O are cationic dyes (they have a net positive charge), whereas Sudan IV is uncharged and neutral. Biological structures targeted by the three dyes also vary. Darrow Red is used specifically for structures containing the nucleic acids RNA and DNA, Safranin O stains nuclear and cell wall assemblies, and Sudan IV is selective for lipids and fatty substances present in cells and tissues. Taking these facts into account, it is obvious that the three dyes are not interchangeable and could generate confusion if they were substituted for one another in a mixture with other dyes.
Optimization of image contrast in black and white photomicrography requires careful tuning of the visible light passing through the specimen and on to the film emulsion. In order to provide a suitable visual difference between elements of the specimen and the background, a working knowledge of the visible light spectral characteristics of both dyes and color filters is essential. The absorption spectra of common biological stains are published in a variety of sources, but two of the best works are the Sigma-Aldrich Handbook of Stains, Dyes, and Indicators and H. J. Conn's Biological Stains. Table 1 contains a listing of the most commonly used biological stains and the spectral range of useful visible light transmittance for each dye.
Color filters are available from professional photographic suppliers and microscope manufacturers in the form of glass mounts or gelatin squares. The most popular series of filters for black and white photomicrography are the Kodak Wratten gelatin filters, which are indexed with a standard numbering system (see Table 2). These filters are ideal for critical photomicrography with a large number of organic dyes available, each of which can be accurately standardized with the amount of dye present per unit area. Filters made by other manufacturers can be referenced to the Kodak numbering system to establish equivalent filtration properties.
Filters for Black and White Photomicrography
Use this tutorial to determine the appropriate starting point for contrast control in Black and White Photomicrography using Kodak Wratten filters.
Start Tutorial »The Wratten filters are composed of gelatin thin films mixed the with appropriate dye and cast onto optical-grade glass plates, then allowed to harden. The hardened films are stripped from the glass and coated with a thin coat of lacquer for protection. Wratten filters are easily trimmed with a pair of scissors to allow modification for placement in microscope filter holders. Although the thin lacquer coat affords some protection to the fragile filters, they should be handled with care by gripping on the corners to avoid abrasion and the accumulation of dirt and oils from the skin. The filters should also be protected, with a glass heat filter, from excess heat generated by the microscope lamp. Continued exposure to heat over an extended period of time can cause the filters to fade. Wratten filters can be cleaned with a camel-hair brush and compressed air, but should not be placed in direct contact with solvents or water to avoid swelling.
Filters can be placed at a number of points in the microscope light path. Many modern microscopes have a carrier positioned between the lamphouse and the base that will hold several filters. Older microscopes often have a filter carrier located just beneath the substage condenser. Avoid placing gelatin filters on the microscope light port or at any point near a conjugate plane (close to the field diaphragm or the specimen) to prevent scratches and other blemishes from being focused in the plane of the specimen with the field diaphragm blades.
When filters are added to the light path, film exposure time must be adjusted (usually increased) to compensate for light absorption by the filter. Each filter has a designated Filter Factor that is used as a rough guide to exposure adjustment when using that filter (see Table 2). A variety of conditions work together to influence the effect on exposure by a given filter, including the spectral sensitivity of the film, light source color temperature, and the visible absorption spectra of the specimen and stain.
The filter factor for any given filter can and should be determined by experiment. Choose a specimen that has a large area of neutral-gray background and take several test exposures without the filter in place. It is wise to bracket photomicrographs throughout the experiment. Next, place the filter in the light path and make a series of exposures, increasing in one-third to one-half f-stop increments, through two to four stops of greater exposure, depending upon filter density. After selecting the best photomicrograph, compare the exposure data and determine the filter factor from the difference in exposure time between the two exposures producing equal densities.
Because automatic camera systems will compensate for the increased density when filters are placed into the light path, a filter factor exposure addition is usually not required. However, in many instances subtle differences in spectral sensitivities of the photomultiplier or photo diodes that measure incoming light intensity to the camera can lead to incorrect exposures. Deeply colored filters may slightly displace the microscope focus, due to optical characteristics of the objectives, so carefully check focus after adding filters to the light path. Always visually inspect the final photomicrographs and manually perform any necessary adjustments.
Interference filters can also be utilized to enhance contrast in black and white photomicrography. These filters are fabricated using several evaporated thin layers of metallic alloys on optical-grade glass, and are highly accurate with respect to spectral transmission and absorption characteristics. Interference filters are designated by both the center and width of the wavelength band that is transmitted. They are commercially available from optics supply distributors or from the microscope manufacturers.
Filters and Transmittance Values
for Black and White Photomicrography
| Filter | Light Transmittance Over 10% | Filter Factor (F-Stops) |
|---|---|---|
| 3 (light yellow) | 450+ | 1.5x |
| 8 (yellow) | 470+ | 1.5x |
| 9 (deep yellow) | 480+ | 3 |
| 11 (yellowish-green) | 470-540 | 3 |
| 12 (deep yellow) | 510+ | 2x |
| 15 (deep yellow) | 520+ | 2x |
| 16 (yellow-orange) | 520+ | 2x |
| 18A (opaque glass) | 320-390 | - |
| 21 (orange) | 540+ | - |
| 22 (deep orange) | 560+ | 2.5x |
| 23A (light red) | 570+ | - |
| 24 (red) | 580+ | - |
| 25 (red) | 590+ | 3x |
| 26 (red) | 600+ | - |
| 29 (deep red) | 610+ | 7.5x |
| 32 (magenta) | 320-500 & 600+ | - |
| 33 (magenta) | 440-460 & 620+ | - |
| 34A (violet) | 320-330, 410-480 & 630+ | 6x |
| 38A (blue) | 360-570 | - |
| 39 (blue) | 310-480 | - |
| 44 (light blue-green) | 440-530 | - |
| 44A (light blue-green) | 430-550 | 15x |
| 45 | 450-510 | 15x |
| 47 (blue) | 400-500 | 15x |
| 47A (light blue) | 380-520 | 10x |
| 47B (deep blue) | 400-470 | - |
| 57 | 480-580 | - |
| 58 (green) | 500-580 | 10x |
| 61 (deep green) | 500-570 | 10x |
| 64 | 440-560 | - |
| 70 (dark red) | 660+ | - |
| 74 (dark green) | 520-540 | - |
| 89B (opaque) | 700+ (infrared) | - |
| 90 (dark grayish-amber) | 560-610 & 680+ | - |
| 92 (red) | 630+ | - |
| 96 (neutral) | 710+ (infrared) | - |
| 98 (blue) | 400-470 | - |
| 99 (yellow-green) | 530-560 | - |
| 102 (yellow green) | 470+ | - |
| 106 (amber) | 520+ | - |
Table 2
Table 2 can be viewed as a compilation of bar charts representing the transmission characteristics of Kodak Wratten filters for black and white photography.
For the purpose of choosing filters and stains for black and white photomicrography, the visible light spectrum can be divided into three primary regions, which lie in the wavelength range between 400 and 700 nanometers. Wavelengths between 400 and 500 nanometers appear visually as blue light when viewed together. Likewise, wavelengths between 500 and 600 nanometers appear green, and those between 600 and 700 nanometers appear red. A dye that absorbs all wavelengths between 400 and 500 nanometers will pass only longer wavelengths between 500 and 700 nanometers (green and red light), and will appear yellow, which is the primary subtractive color obtained by mixing equal portions of green and red light. If a dye transmits light between 400 and 500 nanometers and absorbs light of longer wavelengths (500 to 700 nanometers), then it will appear blue.
As an example, we will examine the absorption spectrum of Congo Red (listed in Table 1), which has strong absorption in region between 400 and 560 nanometers. Blue light wavelengths falling between 400 and 500 nanometers are absorbed by Congo Red, as are green wavelengths that lie between 500 and 560 nanometers. Only longer wavelengths between 560 and 700 nanometers are transmitted by the dye, so the dye appears visually as red. Toluidine Blue and Trypan Blue both transmit blue wavelengths and absorb longer wavelengths, however the two dyes appear to have slightly different tints to the human eye. This is because Trypan Blue absorbs all wavelengths above 500 nanometers while Toluidine Blue only absorbs those wavelengths above 560 nanometers and passes the green wavelengths in the region between 500 and 560 nanometers. Thus, Trypan Blue appears a deep, rich blue while Toluidine Blue appears visually to be a blue-green color. Differences in the visible light absorption spectrum of common dyes (see Table 1) allow the microscopist a great deal of latitude in choosing the proper spectral range when selecting biological stains.
Filters operate in the same manner as dyes with respect to visible light. A Kodak number 38A filter transmits wavelengths between 360 and 570 nanometers, encompassing the colors blue and green. A similar filter, the Kodak number 39, is also a blue filter, but transmits or passes wavelengths between 310 and 480 nanometers. Like Trypan Blue and Toluidine Blue, these two filters pass light with slightly different tints. Filters that transmit all or most of two spectral regions, but block a third (such as the Kodak 39 filter) are often referred to minus filters. The number 39 filter is sometimes called a minus blue filter because it is able to block, or subtract, blue wavelengths from the visible light spectrum. In a similar manner, a number 32 filter appears magenta to the eye, and is called minus green, because it absorbs green light in the 500 to 600 nanometer region. The number 32 filter transmits blue and red light in the 320 to 500 and 600+ nanometer ranges, which together add to produce the color magenta.
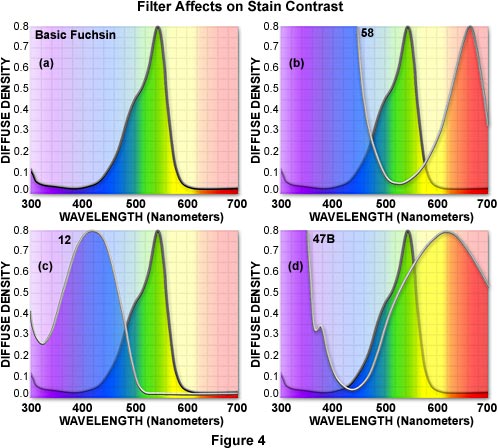
When configuring a microscope for black and white photomicrography of stained specimens, it is convenient to refer to the visible absorption spectra of both the dyes used in the stain and the filters used to control contrast. Figure 4 illustrates a series of filters used to control contrast with the dye Basic Fuchsin (Figure 4(a)), which strongly absorbs light in the 520 to 570 nanometer region and appears reddish-magenta to the eye. The absorption spectrum of Basic Fuchsin reveals a shoulder between 460 and 500 nanometers that absorbs part (but not all) of the blue wavelengths in this region. This shoulder is responsible for a slight red tint seen in the dye that deviates from a true magenta color.
Contrast in photomicrographs made from biological specimens stained with Basic Fuchsin will depend upon the choice of filters. A filter that is complementary to the dye will absorb all or most of the wavelengths transmitted by the dye. This effect is seen in Figure 4(b) where the absorption spectra of Basic Fuchsin and a Kodak number 58 filter are superimposed. Blue wavelengths between 350 and 500 nanometers and red wavelengths above 600 nanometers are absorbed by the filter, darkening the stained regions when captured on black and white film to produce the greatest amount of contrast in photomicrographs.
Less darkening of the stain occurs when a filter is used that has a transmittance range wider than the absorption region of the stain, as illustrated in Figure 4(c). The absorption spectrum of a yellow number 12 Kodak filter, which transmits all visible wavelengths above 500 nanometers, is superimposed over the Basic Fuchsin spectrum in Figure 4(c). The filter clips part of the dye wavelengths in the 450 to 510 nanometer region, producing a modest amount of contrast in resulting photomicrographs.
Minimal darkening of the stain can be achieved by choosing a filter that absorbs light in the same region as the dye. The Kodak 47B filter has a visible absorption spectrum similar in wavelength distribution to Basic Fuchsin (Figure 4(d)), and will produce photomicrographs with less contrast than the number 12 and 58 filters. Other stains can be compared to filters in a similar manner to fine-tune the microscope illumination for black and white photomicrography.
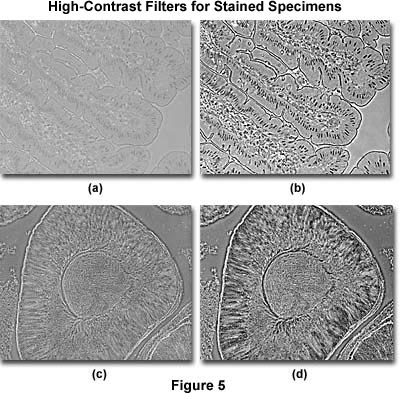
Comparing black and white photomicrographs of stain/filter combinations is helpful in understanding the concept of filtration in photomicrography. Illustrated in Figure 5 are two examples where specimen contrast is dramatically increased through the use of complementary filters. Figure 5(a) and (b) are photomicrographs of stained human ileum (intestine) tissue taken without a filter (Figure 5(a)) and with a filter that absorbs most of the dye color (Figure 5(b)). In this case, the stain is very pale and requires some adjustment to allow the tissue to be differentiated from the background. The increase in contrast produced by the filter helps the specimen stand out against the gray background by darkening specimen color without significantly affecting the background. Photomicrographs in Figures 5(c) and (d) are another example of the use of filters to promote specimen contrast. A stained thin section (Figure 5(c)) of starfish testes is darkened (Figure 5(d)) when a complimentary filter is added to the microscope light path. Darkening the stain helps to reveal details about the intercellular structure in these stained sections, but care must be exercised during filter selection to avoid too much contrast.
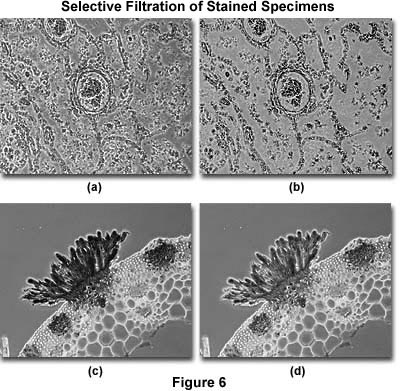
Filters can also be used to enhance contrast and provide detail in specimens stained with more than one color. The photomicrographs illustrated in Figure 6(a) and (b) show a thin section of human lung tissue afflicted with bronchopneumonia. Without filtration (Figure 6(a)), the background is dark and tends to obscure important specimen detail in the lung tissue. With the proper filtration (Figure 6(b)), the background, which is unimportant, is lightened and that part of the specimen containing the most important information becomes more visible. The exact amount and type of filtration to optimize this effect must be determined by experimentation.
To lighten a stain color, or to compensate for an over-stained specimen, a filter that has the same color as the stain should be inserted into the microscope light path. Figure 6(c) shows a heavily stained thin section of basswood stem infected with the fungus Puccinia graminis. The stain is so thick that details of the erupting pustule are obscured, but this artifact is compensated in Figure 6(d) by adding a filter containing the same absorption characteristics as the pustule. In this case, lightening the stain has helped to decrease image contrast and reveal details that were obscured by too much stain.
Employing contrast control through the use of filters should be approached with caution. The final image depends on both the appropriate selection of filters and a determination about which part of the specimen should be adjusted. Too much contrast can worsen the situation, and too little contrast often results in images lacking in sufficient detail to be useful. We recommend extensive experimentation by viewing filters with the specimen in place and by comparing the filter transmission and stain absorption characteristics. Often, the results can be improved by placing different filters into the light path until the best contrast is achieved. Black and white film is relatively cheap, so test the results obtained with various filters by exposing panchromatic film as often as possible.
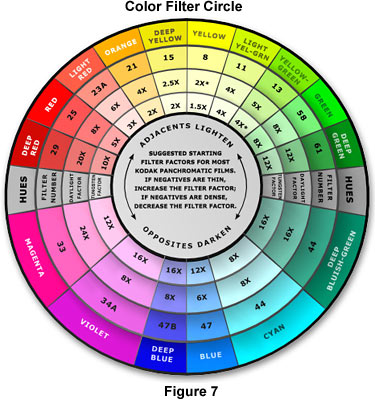
The Kodak Color Filter Circle (Figure 7) contains information about starting points for contrast adjustment using panchromatic films. This chart should be used as a guide when choosing color filters to enhance specimen contrast and differentiate important details from the background. Because stain colors and their visible absorption spectra vary considerably, the final filter choice will depend upon the specimen and the stain or stain mixture. Panchromatic photographic emulsions differ in their response to red, green, and blue light and should be thoroughly tested prior to recording important data. In general, a yellow-green filter, such as the Kodak number 11, should be used to establish the correct gray-scale tones in multiply-stained specimens. When using daylight illumination (xenon lamp or photo flash tube), insert a yellow number 8 filter to compensate for the higher proportion of blue present light with this color temperature. Some panchromatic films have a high red sensitivity and should be used with a number 13 filter for tungsten-halogen illumination or number 11 filter for daylight illumination. It should be mentioned that these filters are intended exclusively for black and white photomicrography and are not to be used with color film. The filter suggestions listed in Table 3 provide a starting point in choosing filters for contrast enhancement.
Suggested Filter/Stain Combinations
| Stain | Contrast Filter | |||||
|---|---|---|---|---|---|---|
| Blue | Green | Cyan | Orange | Yellow | Red | |
| Orange G | - | x | - | - | - | - |
| Azocarmine G | - | x | - | - | - | - |
| Eosin | - | x | - | - | - | - |
| Acid Fuchsin | - | x | - | - | - | - |
| Hematoxylin | - | x | - | x | x | - |
| Aniline Blue | - | x | - | x | x | - |
| Methylene Blue | - | - | - | x | x | x |
| Prussian Blue | - | - | - | x | x | x |
| Toluidine Blue | - | - | - | - | x | x |
| Trypan Blue | - | - | - | - | x | x |
| Light green SF | - | - | - | x | - | - |
| Congo Red | - | - | x | - | - | - |
| Neutral Red | x | x | x | - | - | - |
| Nigrosin | x | x | - | - | - | - |
Table 3
Occasionally, stain combinations resist attempts to produce adequate contrast between specimen details and the background. This happens when two stains colors have similar brightness values and filters are used to adjust microscope illumination color temperature for black and white film. The cure is to find a filter that will absorb one of the colors almost completely while partially absorbing the other color, so that both will have good contrast against the background.
Because biological stain colors can vary depending upon the specimen, it is not always possible to recommend a specific filter, even when the spectral characteristics for the dyes are known. Consider a bluish-purple stain like Crystal Violet that transmits both red and blue wavelengths. Using a Kodak Wratten 23A light red filter with this dye would allow some of the red wavelengths to be transmitted, but the filter will not completely eliminate color from the dye. Similar results are obtained other common red filters including the Wratten numbers 24, 25, and 26. However, all of the common red filters will completely absorb wavelengths from a pure blue dye such as toluidine blue. In case of Crystal Violet, a deep green filter (Wratten number 58) is probably the best choice for contrast enhancement. After adding a filter to the light path, always check specimen contrast through the eyepieces before proceeding with photomicrography.
In addition to contrast control, filters can be used to overcome optical aberration and improve image resolution. Microscope objectives are not equally well corrected for optical aberrations over the entire visible light spectrum. In black and white photomicrography, filters can be employed to utilize only that part of the light spectrum where the objectives have optimum performance, thus affording the best possible image quality. Achromatic objectives are corrected for light in the green portion of the spectrum at wavelengths centered around 550 nanometers. The microscope illumination can be adjusted by adding green filters with a narrow bandwidth to the optical pathway (prior to the specimen) to take advantage of this correction factor. Kodak Wratten filter numbers 58, 61 or 99 are used to restrict the bandwidth of microscope light to the 500-600 nanometer region in order to optimize photomicrography when using achromatic objectives. The bandwidth can be restricted even further by the addition of a yellow filter (Kodak number 15 or similar). Fluorite and apochromatic objectives are better corrected for chromatic aberrations and will not substantially benefit from monochromatic illumination in black and white photomicrography.
Filters can also help produce a modest increase in resolution when the bandwidth of illumination utilizes only the shortest visible wavelengths, which lie in the 380-400 nanometer region. Addition of a Kodak number 47B blue filter to the microscope light path restricts wavelengths passed to the specimen to those between 400 and 470 nanometers. In optical microscopy, point-to-point resolution is calculated according to the equation:
Where R is the smallest resolvable distance between two structural elements, λ is the wavelength of illuminating light, and NA is the numerical aperture of the objective. From this equation, it is obvious that resolution is directly proportional to the wavelength of light. Shorter wavelengths lead to lower values of R, thus to greater resolution. Using this equation, we can calculate that for an objective of numerical aperture equal to 0.9, resolution will be 0.39 microns for red light (700 nanometers), 0.31 microns for green light (550 nanometers), and 0.22 microns for blue light (400 nanometers). Therefore, to achieve the greatest resolution, regardless of the degree of optical correction for the objective, the microscopist can add blue filters to the microscope light path.
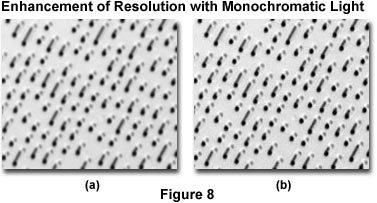
The photomicrographs presented in Figure 8 illustrate the effects of resolution enhancement using monochromatic light produced with filters for black and white photomicrography. Miniature berms on the surface of a compact disk were photographed using Kodak Technical Pan film and a 100x planachromatic reflected light objective with tungsten-halogen illumination operating at a color temperature of 3200 K. The photomicrograph on the left (Figure 8(a)) was made without filtration utilizing only white light from the illumination source. On the right (Figure 8(b)) is a photomicrograph made with a Kodak number 47B (blue) filter inserted into the light path. Note the increased clarity and sharpness of the berms when illuminated with blue light transmitted by the filter.
Filters for black and white photomicrography can be just as critical as those necessary for proper color rendition in color photomicrography. When performing critical work with black and white film, always pay attention to the emulsion characteristics (they are published on the web or accompany the film packaging), and use them as a guide to the starting point for filter choices. By carefully choosing the appropriate color filters for black and white photomicrography, any microscopist can produce excellent black and white images that present sufficient contrast and reveal important details about the specimen.