What Is the Modulation Transfer Function?
The modulation transfer function, or MTF, is a parameter used to evaluate the performance of a lens. MTF provides a quantitative and standardized way to characterize optical systems, so the metric is used by optical designers and microscopists alike to compare lenses and determine the ideal one for an imaging system.
Optical MTF data is used for a range of instruments, including DNA sequencers, cell analyzers, slide scanners, and industrial inspection equipment. To help assist the optical design process, this white paper will explore MTF in detail and explain the different ways it can be used.
Understanding MTF Measurement
Both resolution and contrast are essential for an image to appear sharp. In simple terms, resolution is the ability to transfer details, while contrast is the ability to distinguish between light and dark areas. Even if resolution is high, a low contrast will inhibit your ability to clearly see sample details. High-quality optics transfer more contrast at higher frequencies (i.e., at a higher resolution), so it is important to measure this ability in optics when designing an imaging system. This can be done through MTF.
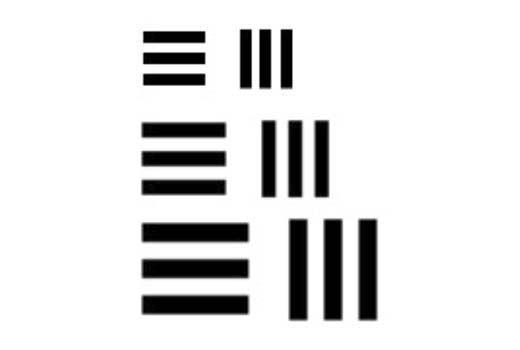
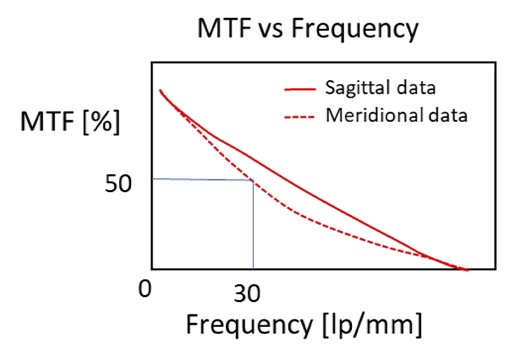
MTF measures a lens’ ability to transfer the contrast of a sample to an image using spatial frequency (resolution). Spatial frequency indicates the number of line pairs (i.e., one black and one white line) per millimeter (lp/mm). Generally, various charts with equally spaced, alternating black and white lines (Figure 1) are used to measure the MTF of a lens. The contrast is then plotted on an MTF chart against the spatial frequency, as shown in Figure 2 below.
Figure 1. Examples of different spatial frequencies. |
Figure 2. Example MTF chart showing contrast (MTF) vs. spatial frequency. The chart shows 50% contrast at a spatial frequency of 30 lp/mm. |
How to Read an MTF Chart
In the MTF chart in Figure 2, the field of view is fixed, the horizontal axis shows the spatial frequency (lp/mm), and the vertical axis shows the contrast. The chart shows that 50% contrast can be achieved with this lens at a spatial frequency of 30 lp/mm.
In most lenses, the contrast is higher at the center of the field of view than at the edges. For this reason, an MTF chart may also show curves in the sagittal and meridional directions. These curves illustrate how the contrast changes depending on the distance from the center of the image.
Sagittal indicates the performance in the radial direction (from the center to the corner of the image), and meridional indicates the performance in the concentric direction (circular). The contrast in the sagittal and meridional directions change due to the influence of off-axis aberrations (i.e., optical errors at different field points), such as coma and astigmatism.
In general, similar sagittal and meridional characteristics creates a more uniform image. This means that if the sagittal and meridional curves are closer to each other on an MTF chart, then the images will have more even image performance on both the X-axis (horizontal) and Y-axis (vertical). A gap, on the other hand, generally indicates an uneven image with aberrations. Ideally you want the curves to be closer to each other for more even image performance.
How to Calculate MTF
MTF shows how the contrast on the surface of the object is reflected on the image plane. Contrast is calculated using the following formula. The ratio of contrast between the object surface and the image plane is MTF.
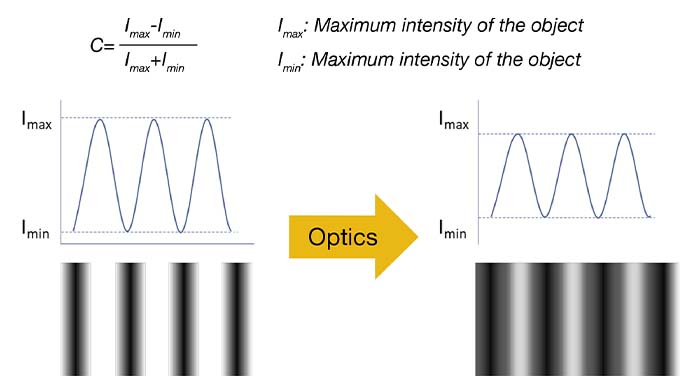
Figure 3. The contrast differs between the object surface on the left and the image plane on the right.
MTF can be calculated for single wavelengths (monochromatic light) or for white light, depending on your application. For instance, laser-based applications for fluorescence or multiphoton imaging may require MTF data for single wavelengths while generic imaging applications may require MTF data for white light. MTF charts for each wavelength can also be compared against each other to determine the overall device performance.
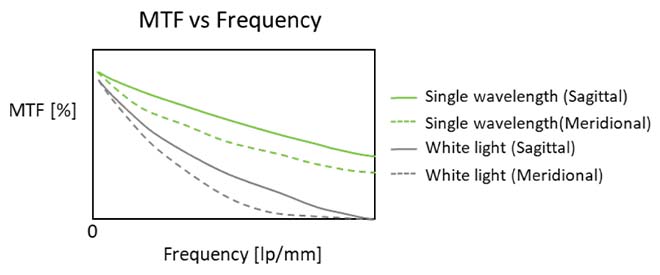
Figure 4. MTF curves for a single wavelength and white light
OEM optical suppliers can provide MTF information and charts for optical components, enabling you to assess the optics for your system design.
How Is the Modulation Transfer Function Used?
1. Comparing the optical performance against the ideal diffraction limit.
The diffraction limit indicates the absolute limit of the resolution in an optical system. By comparing the diffraction limit value with the MTF of the lens system, it is possible to evaluate how close the performance of the lens system is to the theoretical value.
An MTF curve can show you the difference between the ideal optical system and the constructed system at a glance. When comparing the MTFs of the following two optical systems (Figure 5), you can see that System 1 has higher performance than System 2 because it is closer to the diffraction limit value.
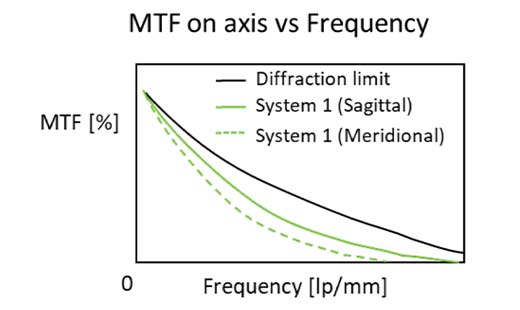 | 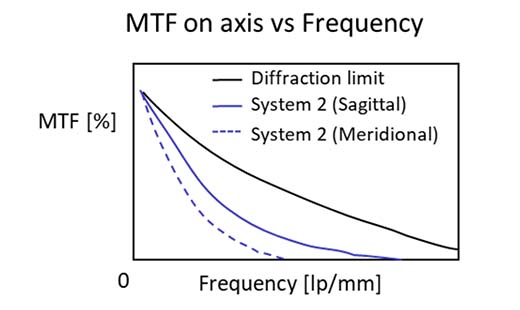 |
Figure 5. MTF curves of two optical systems. The side-by-side comparison enables you to see which system is closer to the diffraction limit.
2. Comparing the performance of different objective lenses.
MTF is a good indicator when you want to compare the performance of different objective lenses since it shows which lens has a higher contrast at a certain spatial frequency. As we mentioned earlier, a higher contrast will lead to better image performance. MTF charts make it easy to compare the contrast of optics since you can visually see which MTF curve is higher.
Consider the MTF graph below (Figure 6) as an example. You can see the MTF performance of Optics A is better than Optics B since the curve is higher. This visual information can help you select the right objective lens for your system design.
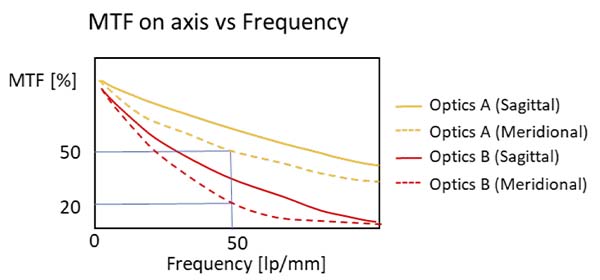
Figure 6. MTF curves of two different objectives. Optics A has a higher curve than Optics B, indicating that it has better optical performance.
3. Determining the MTF at different focus positions in the field of view.
An MTF chart can also show you how sensitive the optics are to defocusing by illustrating the MTF difference between on-axis and off-axis focus positions. The on-axis focus position refers to the center of the field of view that provides a sharp, focused image. The off-axis focus position refers to a position at the corner of the field.
Looking at Figure 7 below, the MTF at the on-axis focus position is 60%, and the MTF at the off-axis focus position is 40%. You can see that the off-axis MTF has deteriorated by 20%. The acceptable numbers vary depending on the application. If the numbers are unacceptable, consider changing the design or switching to different optical components.
Ideally the MTF curve of the off-axis position should be as close as possible to that of the on-axis position to produce a focused image. A gap between the on-axis and off-axis curves (as shown in Figure 7 below) indicates defocusing issues due to aberrations.
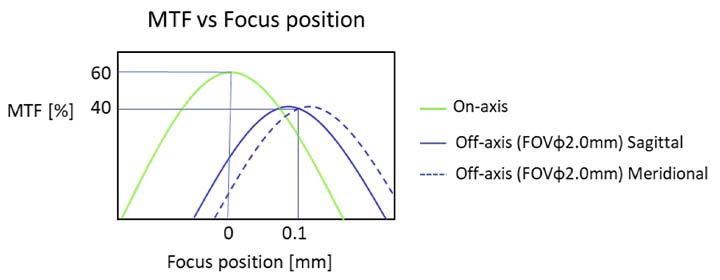
Figure 7. MTF curves at different focus positions (the peak of the curves) in the field of view. The gap between on the on-axis and off-axis curves indicates defocusing issues.
4. Determining the ideal image height for the sensor.
Image height is the distance from the center to the edge of the image. An MTF chart enables you to visually determine the ideal image height at the sensor position of the optical system. You can also check the performance difference between the on-axis and off-axis sensor positions.
Figure 8 below shows an example. Take a look at the MTF at the center and off-axis positions of the sensor. The MTF at the center position is 70%. The MTF of meridional at 5 mm from the center is 50%. Normally, the farther away from the center, the more the MTF deteriorates due to the effects of off-axis aberrations. In this example, the MTF of meridional becomes 20% at 10 mm from the center. For optimal performance, make sure to check the MTF at the image height required for the application while building your system.
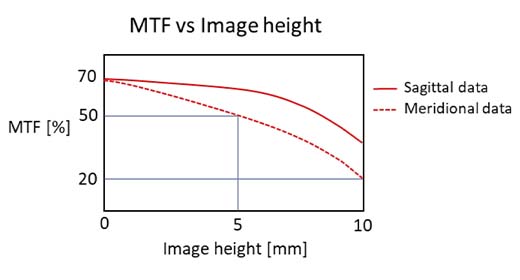 | 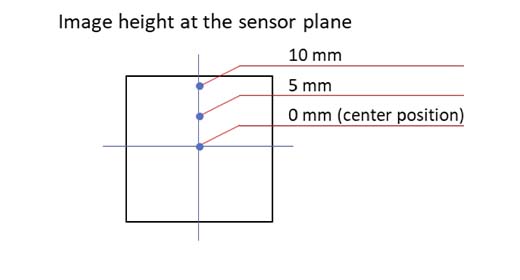 |
Figure 8. MTF chart for different image heights. The MTF deteriorates as it moves farther away from the center.
Another useful way to use MTF charts it to check the MTFs of different optical components within a system, such as an objective and a tube lens. This enables you to see if there is any MTF deterioration due to one of the optical components. With this information, you can adjust the components to achieve the optimal performance needed for the system. For example, it is possible to calculate the MTF of an objective lens alone, a tube lens alone, and an optical system that combines an objective lens and a tube lens.
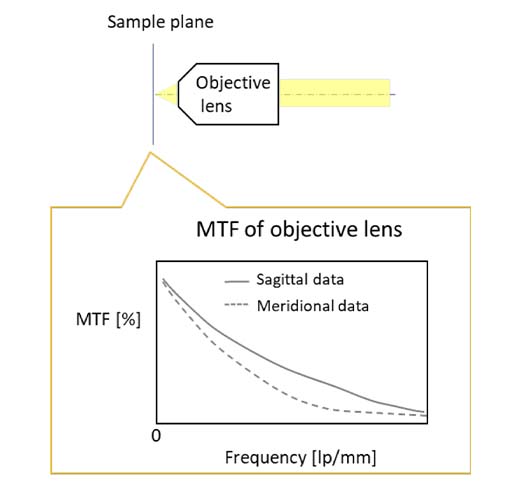 | 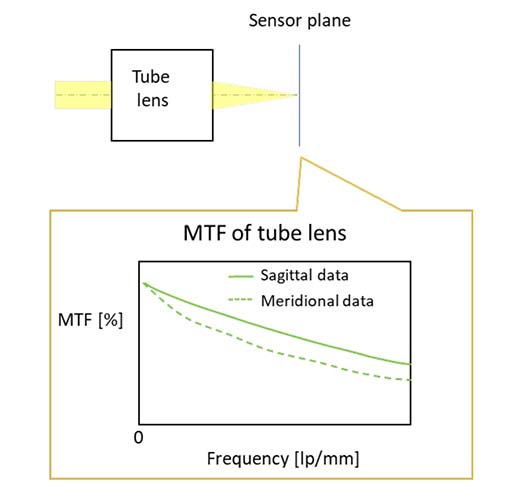 |
Figure 9. MTF charts for an objective lens (left) and a tube lens (right).
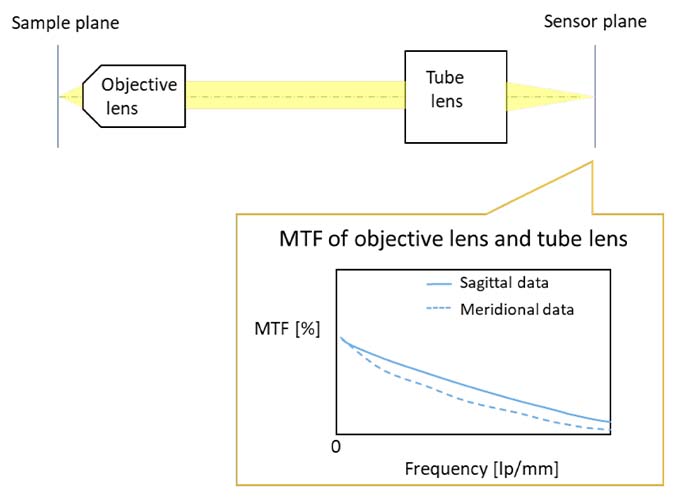
Figure 10. MTF chart showing the combined optical performance of the objective lens and tube lens.
Conclusions
Knowing the MTF of optics under the right conditions will help you build the optical system you need for your instrument design. Note that when evaluating an optical system with MTF, it is necessary to select a sensor with the optimal pixel pitch and Nyquist frequency. For further details, please refer to our white paper, What to Consider When Choosing a Microscope Camera.
If you have questions about MTF data, feel free to contact us. Our experts are always here to help.
MTF Data Provided by Olympus
Olympus discloses MTF data under the condition of an NDA (non-disclosure agreement). This data can be used to be build an optical system with higher optical performance.
Author
Yu Kikuchi, Optical Engineer
Olympus Scientific Solutions
Sorry, this page is not
available in your country.