SILA Optical Sectioning Method for Sharp Imaging of Thick Samples
Authors
Anna Zelená, Application Specialist, Evident Technology Center Europe
Wei Juan Wong, Product Manager, Evident Technology Center Europe
Gabriel Maranon, Product Expert, Bliq Photonics
Alicja Gąsecka, R& D and Production Director, Bliq Photonics
Mariêve Picard, Sales and Marketing Director, Bliq Photonics
Jeck Borne, Systems Engineer, Bliq Photonics
Slide scanners have earned popularity among researchers for their compact constructions and wide range of utilization. One of their powerful applications is a combination with widefield (WF) fluorescence microscopy to detect fluorescence in thin specimens. For applications in thick specimens, a powerful imaging solution is speckle illumination acquisition, or SILA. Combined with our SLIDEVIEW™ VS200 research slide scanner, SILA imaging provides fast optical sectioning for digital slide images. This method removes out-of-focus light from thick samples to greatly improve contrast.
Limitations of Widefield Fluorescence Microscopy
WF microscopy is an imaging technique where a relatively large area of a sample is illuminated with the light of a specific (excitation) wavelength. Fluorescently active molecules are distributed within the sample volume and bound to specific areas through the process known as fluorescent staining. These molecules absorb the excitation wavelength and subsequently emit light of a longer wavelength, which is detected by a camera.
The emitted signal collected by the camera comes from all molecules reached by the excitation light in the whole sample bulk, where the power of the excitation light is sufficiently high. Therefore, the fine fluorescently stained structures in the focal plane are blurred by the presence of out-of-focus light. The solution to this problem is the application of optical sectioning methods, which produce blur-free and sharp images.
Introducing SPARQ Technology for Fast Optical Sectioning
SILA imaging uses SPARQ technology (developed by Bliq Photonics) that combines a HiLo algorithm1 and speckle scrambler to provide fast optical sectioning. This technology enables the removal of out-of-focus light from widefield images, achieving performance similar to that of confocal microscopy. 1-3
This technology implies that two images of the sample are acquired: one with uniform illumination and one with a spatially structured illumination introduced by stochastic laser speckles at the sample. Once both images are acquired, they are combined computationally to produce a blur-free image. The transition between the two imaging states is made using the speckle scrambler, as illustrated in Figure 1.

Figure 1. Acquisition of a SILA image.
1. Uniform Illumination
The uniform illuminated image contains signals coming from objects that are in focus and out of focus. The out-of-focus content appears blurred and therefore contains only low spatial frequency components. Applying a simple high-pass filter to the uniform image would filter out the out-of-focus content and leave the uniform high-frequency image in focus. However, it would also have the undesirable effect of suppressing the low spatial frequency elements present in the focal plane.
To recover the low-frequency content of the sample at the focus plane, a high-frequency structured illumination (produced by the speckles) is acquired and processed. This way it is possible to recover the low-frequency signal and distinguish the signal originating only from the plane of interest.
2. Speckle Illumination
Speckles are random fluctuations originating from diffuse reflections or scattering events over medium irregularities, characteristic to coherent light sources such as lasers. The interference of these reflections or scattering events generate the granular, stochastic patterns projected on the sample.4
Speckle illumination applies a high-frequency spatial modulation to the sample. An important feature of this type of illumination is that the modulation contrast is confined to the focal plane of the microscopy system. Therefore, measuring the local contrast of the image modulation enables one to determine the extent to which the object is in focus or contains in-focus contributions.
3. Combining Both Images
From the uniform illumination image, using a high-pass filter, the high frequencies of the focus plane are extracted. From the speckle illumination image, the extent to which the object is in focus or contains in-focus contributions is determined by the local contrast measurement. By applying a low-pass filter over the local contrast measurement image, the low-frequency in-focus signal is obtained.
As such, by properly adjusting the high and low-pass filters, the low-frequency in-focus content obtained from the speckle illumination image can complement the high-frequency in-focus content obtained from the uniform illumination image. Merging the high- and low-frequency image content results in a full resolution, focused image containing all frequency components within the frequency bandwidth of the imaging system (Figure 2).1-3

Figure 2. Diagram of SILA processing.
It is interesting to note that it is also possible to adjust the degree of optical sectioning simply by changing a setting called the sectioning thickness (ST) parameter. Increasing the ST parameter is analogous to increasing the size of the pinhole of a confocal microscope.
Raising the value of the ST enables contributions from a wider range of speckle contrast (i.e., a larger signal volume) during SILA image processing. The overall intensity increases and the signal-to-noise ratio (SNR) changes accordingly. However, as in the pinhole analogy where the gain in signal is due to collection outside the focal plane, the increase of ST will result in a less optically sectioned SILA image.
Example of an Experimental Result with the SILA Optical Sectioning Method
A 16 µm cryostat section of mouse kidney (FluoCells Prepared Slide #3, F24630) was illuminated by WF and SILA imaging. The ST parameter was set to 2 (VS200 scanner, UPLSAPO40XS objective, 1.25 NA, 300 µm WD, Hamamatsu ORCA-Fusion camera). This was chosen as an optimal parameter for illumination considering the sample thickness. An ST parameter that is too small may result in graininess on the generated SILA image due to the inherent stochastic nature of speckles.5
The excitation wavelength used for acquisition was 488 nm. A multiband dichroic mirror (for DAPI, FITC, Cy3, and Cy5) and a single emission filter for fluorescein isothiocyanate (FITC) was used. The exposure time of the camera was set to 60 ms. Figure 3a shows the WF image, and Figure 3b shows the same region scanned by SILA imaging with the ST set to 2 at the same Z-position. Improved contrast is observed throughout the whole sample. Focusing on areas 1–4, we can see that SILA images visibly show more details than the WF method.
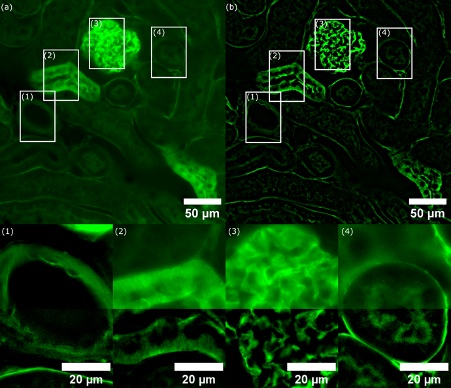
Figure 3. (a) WF image of a mouse kidney stained with Alexa Fluor 488 wheat germ agglutinin (W-11261). White rectangles mark the four regions of interest (ROIs 1–4) of compared structures. (b) SILA optically sectioned image with an ST parameter of 2 and corresponding to 6.803 µm. Insets show zoomed-in ROIs (1–4) with merged channels for WF and SILA imaging (top half: WF, bottom half: SILA). We can see that the image contrast with SILA imaging is highly improved. Some structures in the WF image are hardly noticeable in comparison. Note that detailed ROIs are shown with different scales of intensities to demonstrate the resolved detailed structures.
Optical Design of the SILA Imaging System
The SILA optical sectioning device is built on a widefield slide scanner (our VS200 system) by replacing the regular fluorescence light source with a source of coherent light produced by laser diodes coupled to a single mode fiber. The single-mode coupled laser source is projected through the speckle scrambler unit, which generates speckles at the sample plane for the structured illumination and removes speckles for the uniform illumination. By precisely controlling the laser illumination and the scrambler unit, individual SILA images are computed and stitched together, forming the optically sectioned, whole slide image.

Figure 4. Diagram of SILA construction, containing a coherent source of light, a speckle scrambler producing uniform or speckle illumination, an optical path containing an objective introducing the light to the sample and collecting emitted light, and a camera as a light detector.
Quality Measurements
1. Scanning Time
The scanning time of SILA imaging has been tested on small areas of 5 mm × 5 mm. Even though we acquired a pair of images for each camera field of view, the acquisition time of SILA images does not double in comparison to WF images. For example, we observe an increase of only 53% in the acquisition time for the 40X air objective. Further results are illustrated in Table 1.
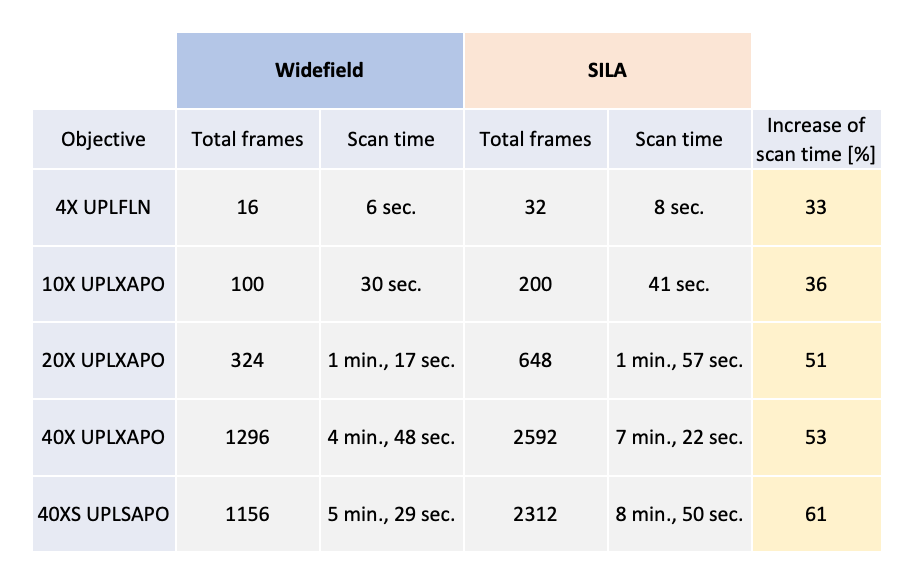
Table 1. Recorded scan time values for WF and SILA images acquired by an ORCA-Fusion camera (Hamamatsu Photonics) with 4 channels (DAPI, FITC, CY3, CY5) and an exposure of 50 ms for a scan area of 5 mm × 5 mm. The increase in scan time is calculated for each magnification individually.
2. Resolution
The optical resolution of SILA images is the same as the WF images. The theoretical resolution for objectives with a high NA has been simulated as 0.2 µm in the lateral direction and 0.45 µm in the axial direction. The experimental point spread function (PSF) values have been measured by an oil immersion objective (UPLXAPO100XO, 1.45 NA) on a sample containing fluorescent beads (TetraSpeck Microspheres, 0.1 µm, fluorescent blue/green/orange/dark red) with a 520 nm emission wavelength. The full width at half maximum (FWHM) for WF images is 0.22 µm in the lateral direction and 0.47 µm in the axial direction. We confirmed that theoretically calculated values coincide with the experimentally measured PSFs on very small beads.
3. Optical Sectioning Ability
The strength of SILA imaging resides in its ability to perform optical sectioning. In Figure 5a–d we can see an example of a subregion of the mouse kidneys from Figure 3 under different ST parameters, with corresponding orthogonal views in Figure 5e–h. The whole sample has been acquired as a Z-stack of 39 images with Z-spacing set to 0.34 µm. With decreasing ST, we can see increasing contrast between structures and background as shown in Figure 5i. We can also identify detailed structures more easily.
To demonstrate it, we plotted a line profile in the X-direction of one Z-section at the exact same spot for each ST parameter and for the WF image. Comparing the normalized line profiles clearly shows how details are more prominent with SILA imaging compared with a typical WF system. Intensity peaks corresponding to structures are higher compared to the intensity of background and narrower with the decreasing ST parameter.
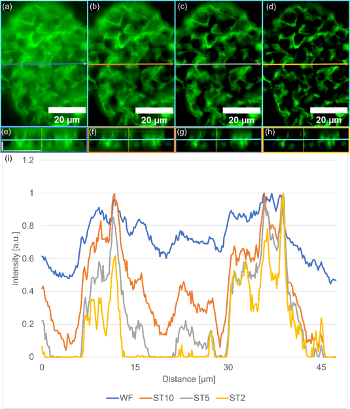
Figure 5. Optical sectioning improvement using SILA illumination compared to WF. (a) WF illumination, (b) SILA illumination with ST10, (c) SILA with ST5, and (d) SILA with ST2. Each image contains an arrow indicating the line profile measurement and position for the orthogonal view plane in the X-direction (e–h). Each SILA image with different ST parameters and each WF image are acquired as Z-stacks, including the orthogonal view in the X-direction. Blue lines indicate the same Z-plane shown in a–d. The horizontal scale bar corresponds to 20 µm, and the vertical scale bar corresponds to 5 µm and applies to all subfigures. (i) Recorded line profiles are indicated in a–b and compare WF in blue, SILA with ST10 in orange, SILA with ST5 in gray, and SILA with ST2 in yellow. All plots are normalized to 1. We see an improving contrast when decreasing the ST parameter.
4. Depth of Field
The SILA optical sectioning method achieves the imaging of samples whose thickness is beyond several hundred microns. Particularly, when samples are cleared, the penetration depth of SILA imaging is only limited by the working distance of the objective. If the specimens are not cleared, light can be scattered by the sample structures, hindering the reach of the deeper cell layers.6
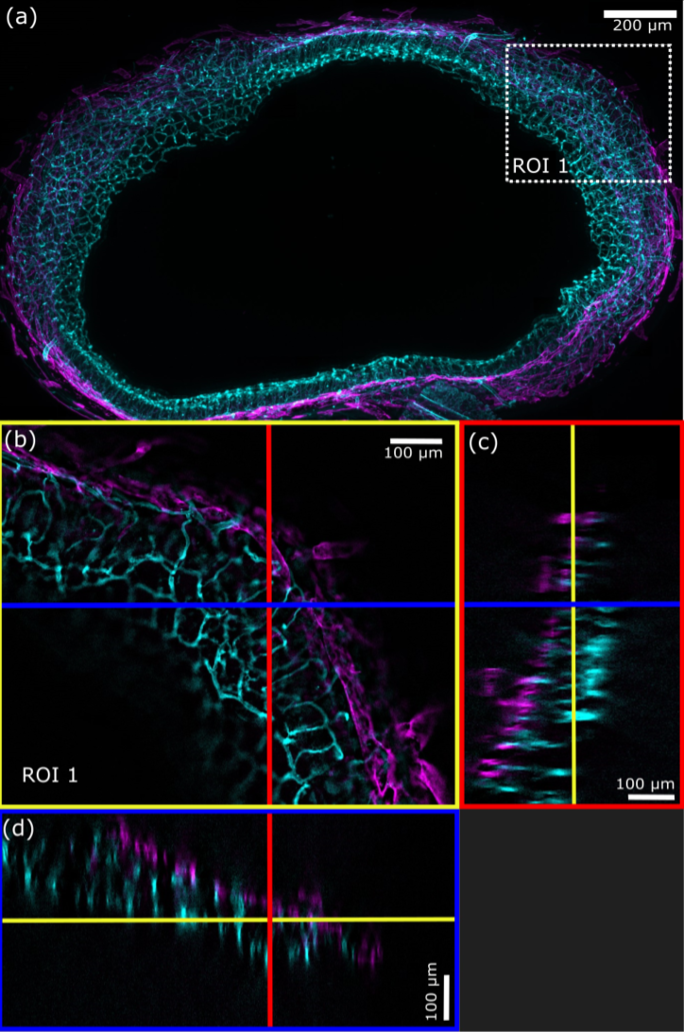
Figure 6. a) Maximum intensity projection (MPI, 188 planes, Z-spacing = 2.36 μm) of a SILA (ST = 2) image of mouse intestine shows blood vessels (cyan) and lymphatic vessels (magenta). b) White dashed square indicates the zoomed ROI 1 from (a), where the blue line indicates the position of the XZ orthogonal view, and the red line indicates the position of the YZ orthogonal view. c) Blue rectangle shows the orthogonal view in the YZ-direction, and d) the red rectangle shows the orthogonal view in the XZ-direction. Yellow lines indicate the Z-plane shown in (b). (FluoTissue 450 μm mouse intestine section, Sun Jin lab) processed by RapiClear 1.52).
5. Repeatability
SILA image processing enables the computation of an image with an optical sectioning from a uniform and a speckle image. Ideally, the speckle structure would be completely filtered out and not observable in the final SILA image. However, this is not the case. Speckle illumination inherently imposes a slight variation in the signal intensity. For example, in one image, a speckle may illuminate a sample detail, while in another it may not. This phenomenon explains the residual intensity variations observed in the final image. This variation is stochastic by definition, and it is a strength (optical sectioning and depth of penetration) and a limitation of the technique (signal intensity variation).
To investigate the signal intensity variation, we recorded a sequence of 10 scans (see Figure 7) for four different ST parameters (see Figure 8a). For each sample, the coefficient of variation (CV) was calculated over 90 arbitrarily chosen ROIs containing structures to quantify the variation of intensity throughout the scan sequence:
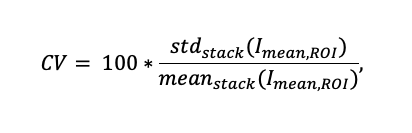
Here, Imean,ROI is the mean fluorescence intensity of one ROI for a single scan. Whereas stdstack and meanstack are respectively the standard deviation and mean values of the Imean,ROI, for the whole scan sequence of 10 scans. Figure 7c shows an example of 25 ROIs and their mean fluorescence intensity profiles over those 10 scans.
The CV, calculated for three different samples for areas containing structures, decreases as a function of ST (Figure 8b); when a larger value of the sectioning parameter is imposed, the strength of the spatial filtering on the speckle image is weaker, resulting in smaller intensity variations on the SILA images. The coefficient of variation for SILA images measured on 3 different structures with 90 detected ROIs is on average 3.7±1.4%. For comparison, the variation in signal intensity in WF mode is approximately 0.3% and is inherent to the system.
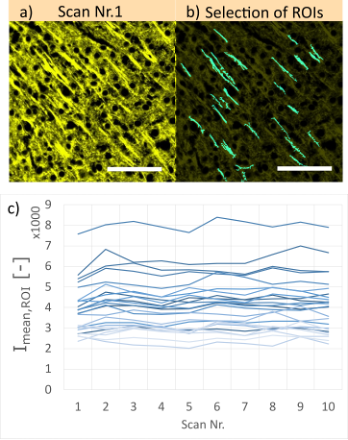
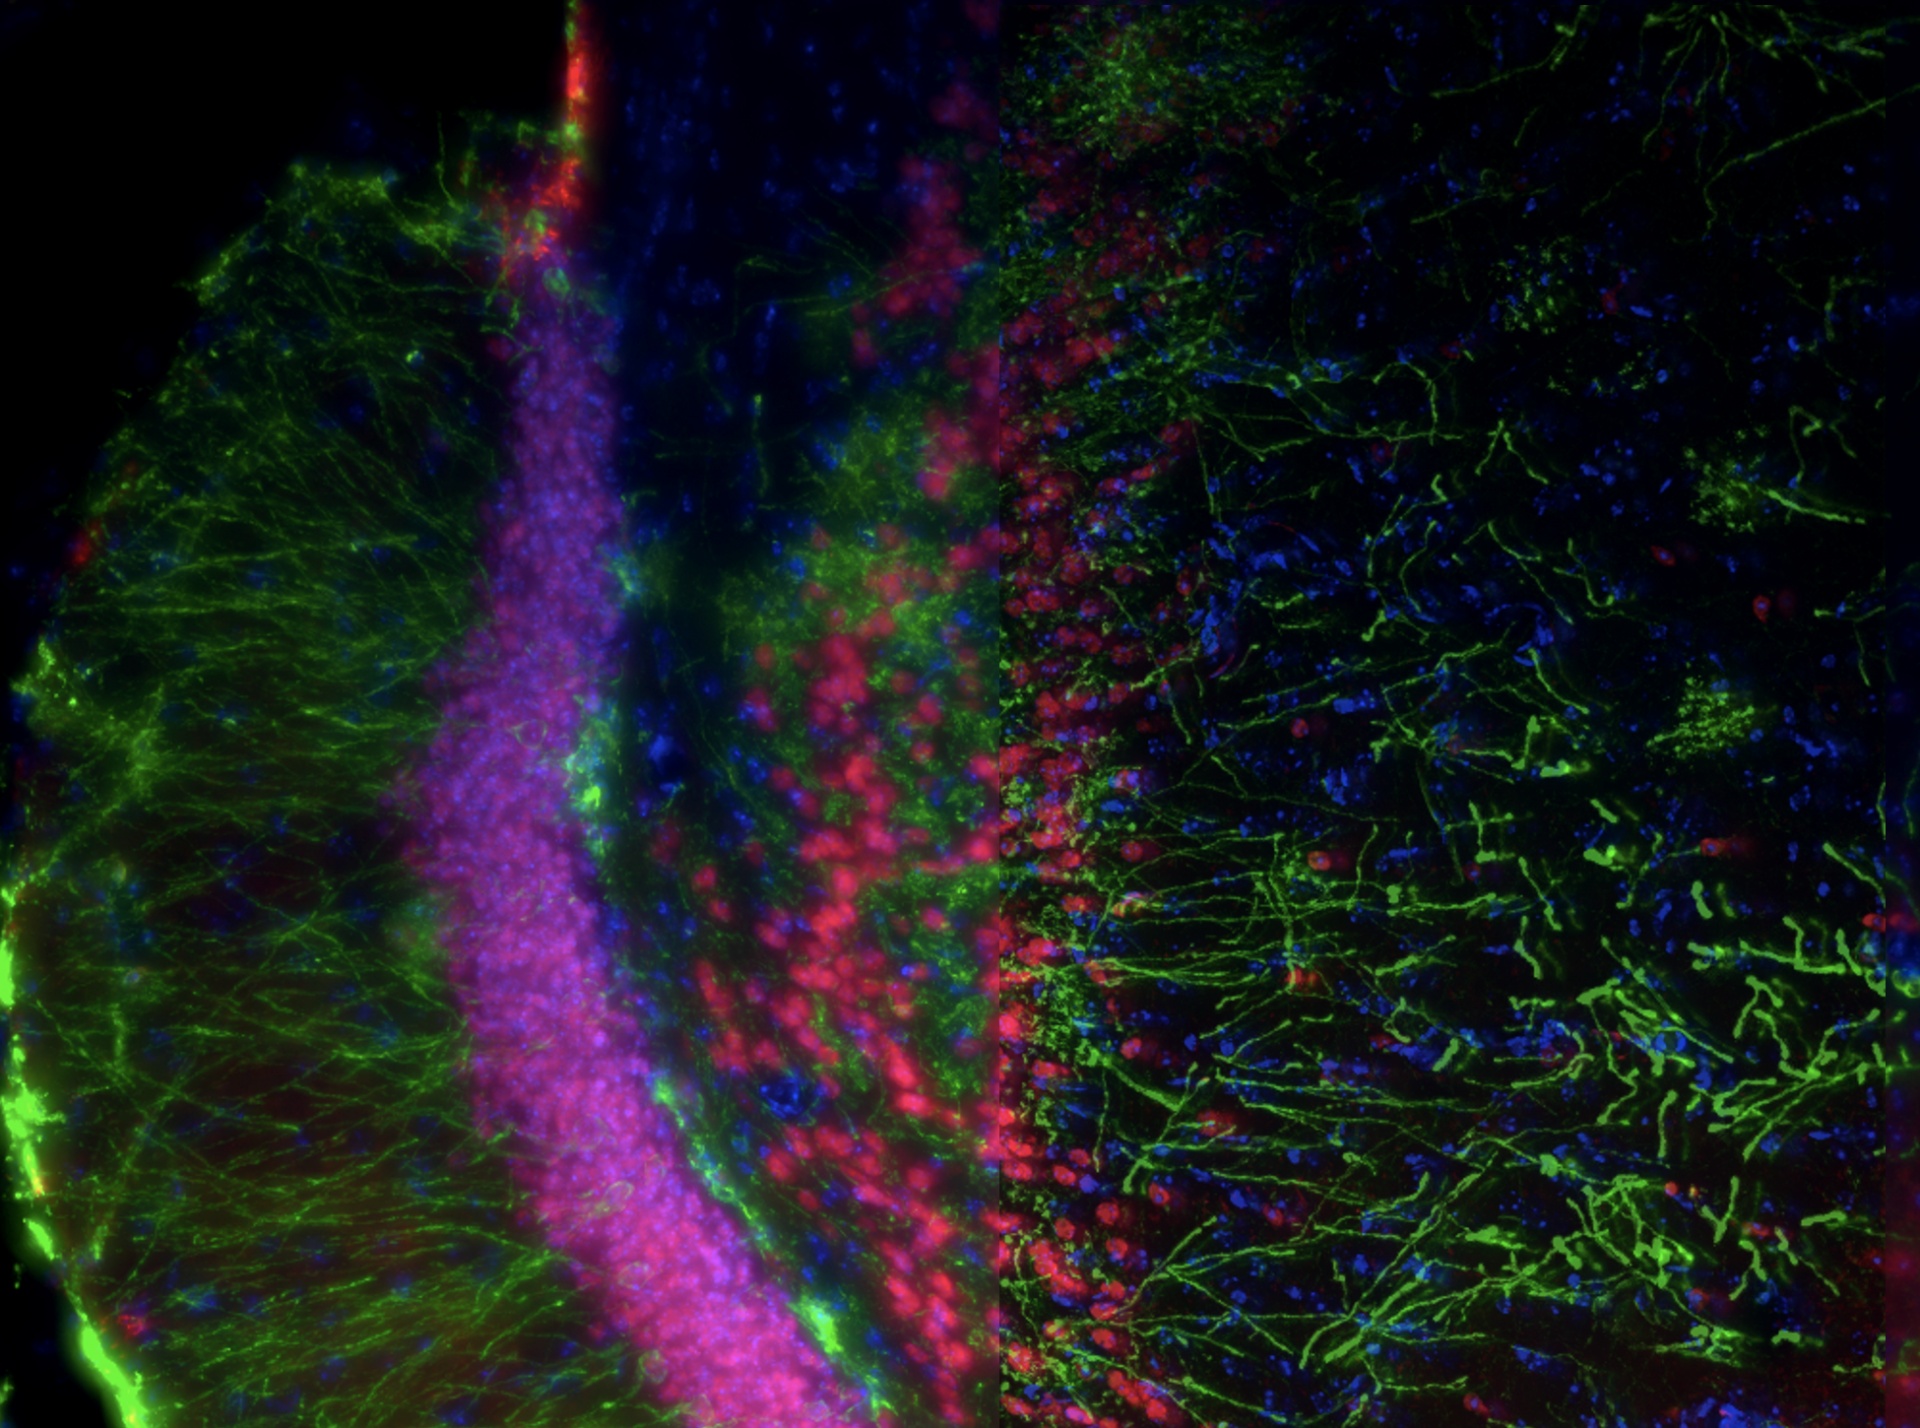
Figure 7. a) Example of a mouse brain sample (Cy3 stained, 100 µm thick) acquired by SILA imaging with an ST of 10 at 40X magnification. Each area was scanned 10 times at the same focal plane and area. b) Cyan regions of interest (ROIs) show chosen structures for our measurements of mean fluorescence intensity (Imean,ROI). Scale bars correspond to 50 µm. c) Mean intensity profiles of the chosen ROIs shown previously. Each line corresponds to one ROI. Note that for better interpretation, only a small section of the image containing 25 ROIs is shown.
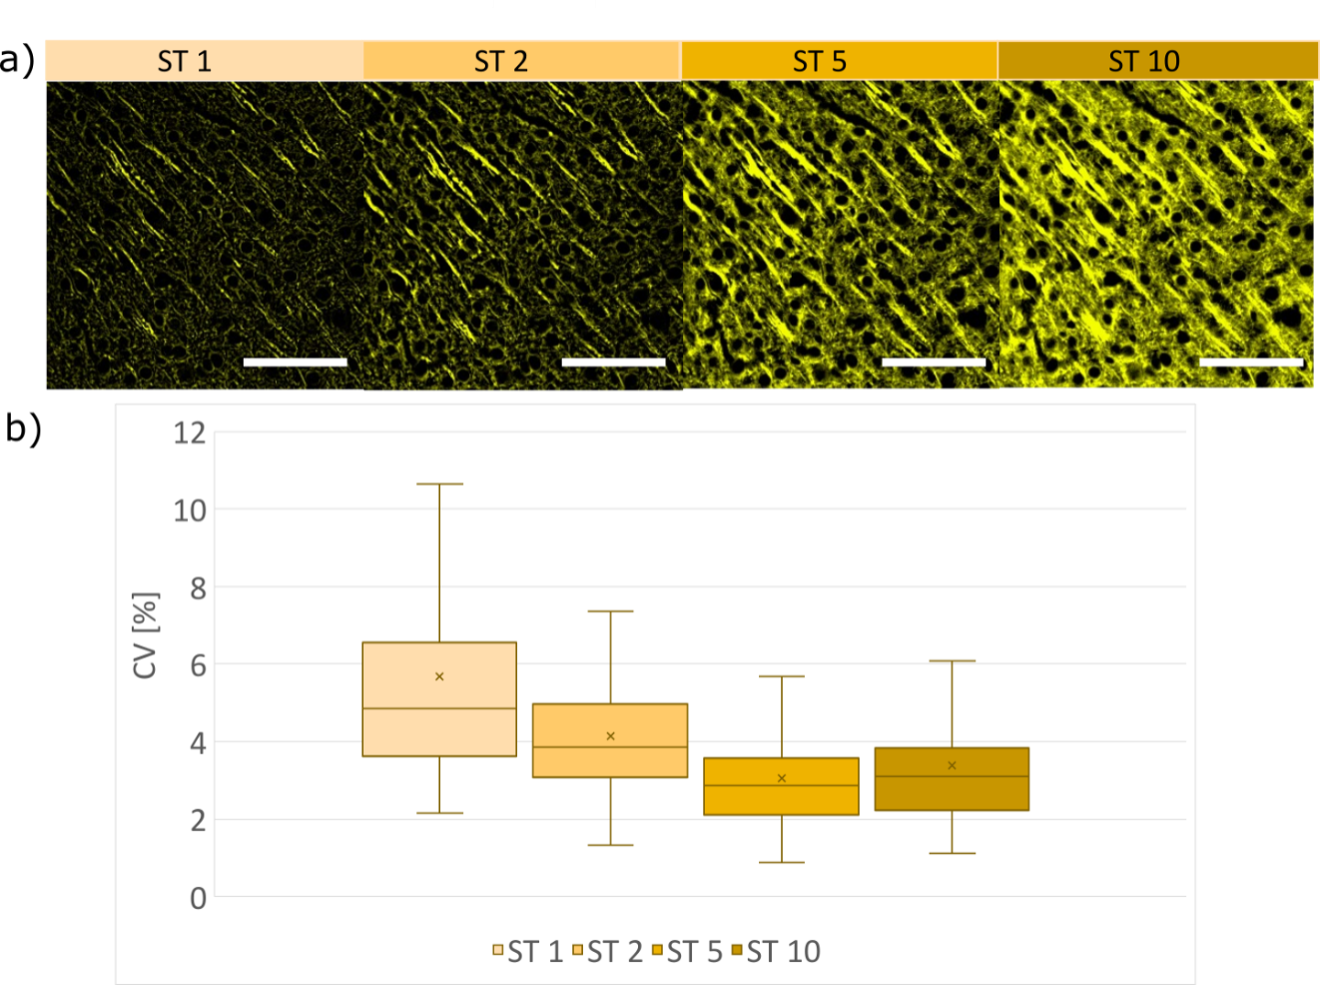
Figure 7. a) Example of a mouse brain sample (Cy3 stained, 100 µm thick) acquired by SILA imaging with an ST of 10 at 40X magnification. Each area was scanned 10 times at the same focal plane and area. b) Cyan regions of interest (ROIs) show chosen structures for our measurements of mean fluorescence intensity (Imean,ROI). Scale bars correspond to 50 µm. c) Mean intensity profiles of the chosen ROIs shown previously. Each line corresponds to one ROI. Note that for better interpretation, only a small section of the image containing 25 ROIs is shown.
Comparison with Other Optical Sectioning Techniques
In the figures below, we compare SILA imaging with regular widefield microscopy, deblur algorithms, deconvolution, and confocal laser scanning microscopy. SILA imaging offers a vast improvement in optical sectioning and contrast compared to regular WF imaging using a deblur algorithm. When compared to deconvolution, SILA technology improves the image quality. In addition, its on-the-fly optical sectioning capabilities reduce the long processing time often associated with capturing large whole slide images.
As for comparison to confocal microscopy, SILA technology comes remarkably close in terms of image quality. As expected, widefield microscopy suffers from the presence of background fluorescence. Both confocal and SILA microscopy produce optically sectioned images of much higher contrast and reveal delicate details in the cellular organization, despite the scattering nature of the sample. Further comparison between SILA and confocal microscopy must be done to compare image details and the spatial variations in intensity distribution. However, the performance of SILA technology is sufficient for qualitative evaluation and colocalization studies. SILA can act as a fast scanning device to sift through large amounts of samples. Those samples with structures of interest can then be taken to the confocal microscope for quantitative imaging.
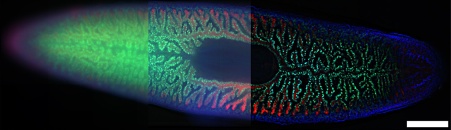
Figure 9. Image of a planarian flatworm, Schmidtea Mediterranea (20X objective). Three techniques are compared: a) WF image, b) WF image using a deblur algorithm, and c) SILA image with an ST parameter of 5. Blue: DAPI; Green: inner intestine cells; Red: outer intestine cells. Samples provided by Amrutha Palavalli, Department for Tissue Dynamics and Regeneration, Max Planck Institute for Multidisciplinary Sciences, Goettingen, Germany. Scale bar corresponds to 500 µm, and it applies for all subfigures.
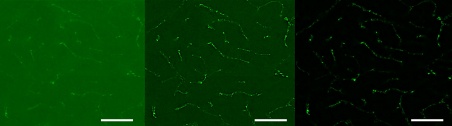
Figure 10. Image of a thick mouse brain stained with MAP2 (20X objective). Three techniques are compared: a) WF image with an extended focal image (EFI) projection, b) WF image with EFI projection and applied deconvolution, and c) SILA image with EFI projection and an ST parameter of 2. Scale bars correspond to 50 µm.
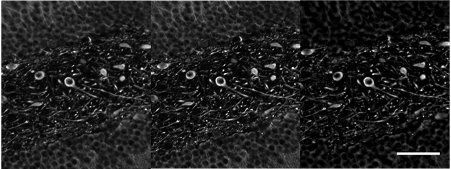
Figure 11. Image of a mouse brain sample labeled with glial fibrillary acidic protein (GFAP), showing neurons (20X objective). Three techniques are compared: a) confocal image acquired using a FLUOVIEW™ microscope, b) same confocal image with additional deconvolution, and c) SILA image with an ST parameter of 2. Scale bar corresponds to 50 µm, and it applies for all subfigures.
Conclusion
The SILA optical sectioning device for the VS200 scanner enables us to achieve images with improved contrast for thicker samples. Compared to WF microscopy, the scanning time increases on average by 53% when using the 40X air objective. The optical depth we can achieve is limited only by the working distance of our optical setup, as we confirmed by scanning very thick samples with a thickness of up to 500 μm. The axial resolution of SILA is the same as WF imaging, but the optical sectioning is greatly enhanced and can be controlled via the sectioning thickness parameter.
When a larger value of the ST parameter is imposed, the strength of the spatial filtering on the speckle image is weaker, resulting in smaller intensity variations on the SILA images, which is measured on our examples to be on average 3.7±1.4%. The higher intensity variation from the ST parameter of 1 can be limited by increasing the ST parameter. This adjustment should be considered when quantitative analysis of fluorescence intensities is required.
The system enables us to quickly obtain images comparable to confocal microscopy or with applied deconvolution. We believe that this technology can be applied to fast slide scanning of thick samples, and that it is beneficial to obtain crisp and high-contrast images with a sharp focus on details.
References
- Lim, D., Ford, T., Chu, K.K., and Mertz, J. 2011. "Optically Sectioned In Vivo Imaging with Speckle Illumination HiLo Microscopy." Journal of Biomedical Optics. 16, 016014.
- Lim, D., Chu, K.K., and Mertz, J. 2008. “Widefield Fluorescence Sectioning with Hybrid Speckle and Uniform-Illumination Microscopy.” Optical Letters. 33, 1819–1821.
- Mertz, J. and Kim, J. 2010. “Scanning Light-Sheet Microscopy in the Whole Mouse Brain with HiLo Background Rejection.” J. Biomed. Opt. 15, 016027.
- 4. Goodman, J. W. 2007. “Speckle Phenomena in Optics: Theory and Applications.” Roberts and Company Publishers.
- Schniete, J., Franssen, A., Dempster, J. et al. 2018. “Fast Optical Sectioning for Widefield Fluorescence Mesoscopy with the Mesolens based on HiLo Microscopy.” Sci Rep, 8, 16259.
- Richardson, D. S. and Lichtman, J. W. 2015. "Clarifying Tissue Clearing." Cell. 162.2: 246–257.
Acknowledgement to the entire VS200 team at the Evident Technology Center Europe.
Products related to this application
Sorry, this page is not
available in your country.