TruAI Based on Deep-Learning Technology for Quantitative Analysis of Fluorescent cells with Ultra-Low Light Exposure
Introduction
Fluorescent labels are an invaluable tool in modern microscopy-based cell studies. The high exposure to excitation light, however, influences the cells directly and indirectly through photochemical processes. Adverse experimental conditions can lead to photodamage or phototoxicity with an observable impact on cell viability. Even if no direct effect is observed, strong light exposure can influence the cells’ natural behavior, leading to undesired effects.
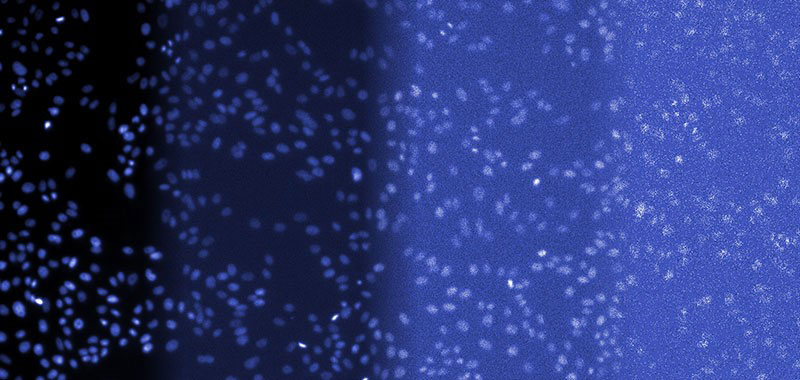
In long-term live-cell experiments, fluorescence observation with minimal light exposure is particularly desirable. However, lower light exposure results in lower fluorescence signal, which typically decreases the signal-to-noise ratio (SNR). This makes it difficult to perform quantitative image analysis (Figure 1).

Figure 1
Overview image to illustrate the different light levels involved in this study.

Figure 2
From left to right: DAPI-stained nuclei of HeLa cells with optimal illumination (100%), low light exposure (2%), very low light exposure (0.2%), and extremely low light exposure (0.05%). The SNR decreases significantly, because signal levels decrease to the camera’s noise level, eventually reaching the detection threshold of the camera. Contrast optimized per SNR for visualization only.
The Technology Behind TruAI
From a technological point of view, the analysis of cells with ultra-low light exposure is a problem of analyzing images with very low SNR (Figure 2). To address this issue and analyze low-signal images with robustness and precision, Olympus has integrated an image analysis approach based on deep neural networks, called TruAI, into cellSens imaging software and the ScanR system. This kind of neural network architecture has recently been described as the most powerful object segmentation technology available.
A neural network of this kind can easily adapt to various challenging image analysis tasks, making it an optimal choice for the non-trivial quantitative analysis of cells with ultra-low light exposure. In a training phase, the neural networks automatically learn how to predict the desired parameters, such as the positions and contours of cells or cell compartments, a process called segmentation of objects of interest.
During the training phase, the network is fed with pairs of example images and “ground truth” data (i.e. object masks where the objects of interest are annotated). Once the network is trained, it can be applied to new images and predict the object masks with high precision.
Typically, in machine learning, the annotations (e.g., boundaries of cells) are provided by human experts. This can be a tedious and time-consuming step because neural networks require large amounts of training data to fully exploit their large potential. To overcome some of these difficulties, cellSens software offers a convenient training label interface.
On the other hand, as a much simpler way, the microscope automatically generates the ground truth required for training the neural network by acquiring reference images during the training phase.
For example, to teach the neural network the robust detection and segmentation of nuclei in ultra-low exposure images, the microscope automatically acquires large numbers of image pairs where one image is taken under optimal lighting conditions, and the other is underexposed. These pairs are used to train the neural network to correctly analyze the noisy images created with ultra-low exposure levels.
Since this approach to ground truth generation requires little human interaction, large amounts of training image pairs can be acquired in a short time. The neural network can learn to adapt to variations, including different SNR levels and illumination inhomogeneities with a high variation of training images, which results in a learned neural network model that is unaffected by these issues.
Low-Signal Segmentation Training
To train the neural network to detect nuclei robustly in varying SNR conditions, the system is set up to acquire a whole 96-well plate with 3 × 3 positions in each well. The following images were acquired for each position:
- DAPI image with 100% light exposure for an optimal SNR (200 ms exposure time and 100% LED excitation light intensity)
- DAPI image with 2% light exposure (4 ms exposure time and 100% LED excitation light intensity)
- DAPI image with 0.2% light exposure (4 ms exposure time and 10% LED excitation light intensity)
- DAPI image with 0.05% light exposure (4 ms exposure time and 2.5% LED excitation light intensity)
The system uses 90 wells for training and excludes the other six wells for later validation. Nuclei positions and contours are detected in the DAPI image with an optimal SNR and standard image analysis protocols. The segmentation masks are paired with the images that have reduced the SNR and are used for training, as shown in Figure 3. Training took about 2 hours and 40 minutes on a PC with an NVIDIA GeForce GTX 1070 GPU. After training, the neural network can detect nuclei at all exposure times.

Figure 3
Training the neural network. Pairs of images with high and suboptimal SNR are used to teach the neural network object detection in all SNR conditions.
Applying Low-Signal Segmentation
The trained neural network can now be applied to new images with different SNRs following the workflow depicted in Figure 4. You can view the resulting contours at different SNRs in Figure 5.

Figure 4
Applying the trained neural network (inference). The network has been trained to predict object positions and contours in varying conditions, including very low SNR images.

Figure 5
Examples of detected objects by TruAI in images with different SNRs acquired with light exposure levels of (from left to right) 100%, 2%, 0.2%, and 0.05%. Contrast optimized per SNR for visualization only.
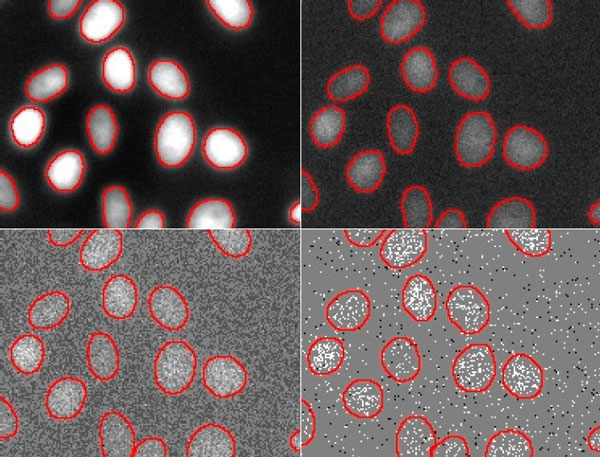
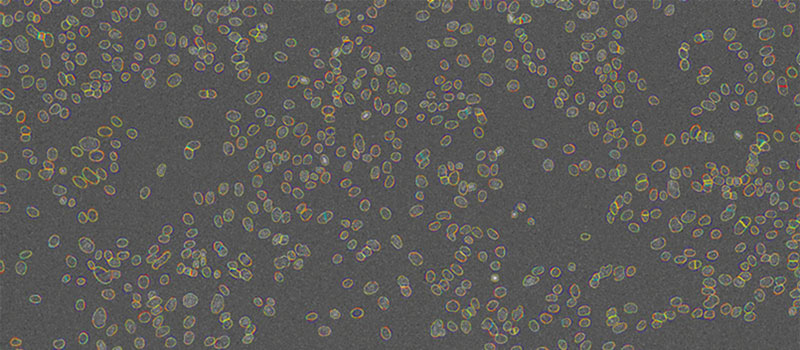
Direct comparison of the segmentation results at different SNRs (Figure 6) and an overlay of contours at different SNRs clearly demonstrates the network’s detection capabilities at reduced exposure levels (Figure 7). The contours deduced from the images overlap almost perfectly (red, yellow, teal), except for the lowest light exposure (blue contours). This indicates that the limit for robust detection with the neural network lies between 0.2% and 0.05% light exposure.

Figure 6
Nuclei segmentation results by TruAI for different SNR images acquired with light exposure levels of (from top left to bottom right) 100%, 2%, 0.2% and 0.05%. The contours derived from the lowest SNR (bottom right) deviate significantly from the correct contours and indicate that the limit of the technique for quantitative analysis at ultra-low exposure levels is between 0.2% and 0.05% of the usual light exposure. Contrast optimized per SNR for visualization only.

Figure 7
Nuclei contours detected by TruAI at 4 different SNRs shown on top of the image acquired with the lowest light exposure level (0.05%). Contrast optimized for visualization only.
Validation of the Results
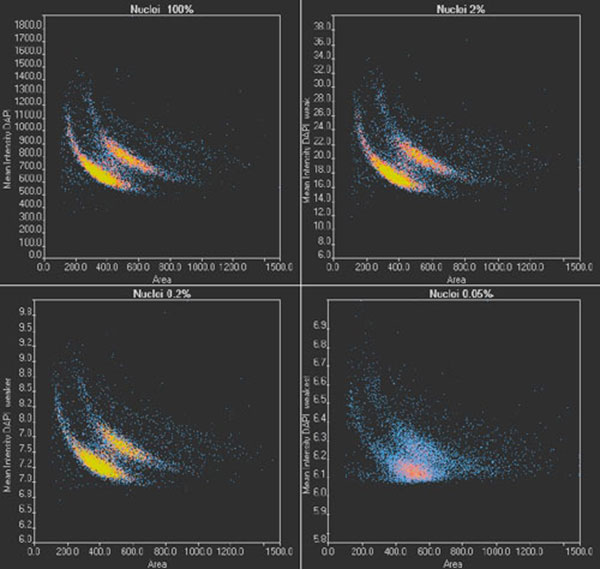
To validate the results of TruAI and confirm the limit for quantitative analysis, images of two wells per illumination condition are analyzed. Nuclei positions and contours are determined, the nuclei are counted, and the area of the nucleus and the mean intensity of the DAPI signal are measured. With the scanR system’s high-content screening software, the results can be analyzed with regards to nuclei populations. The results under optimal conditions (Figure 8, top left) show two distinct populations, correlating with cells in the G1 (single DNA content) and G2 stage (double DNA content) of the cell cycle.
When the images are analyzed at only 2% exposure, the dynamic range is reduced dramatically (Figure 8, top right). However, after rescaling the plot, the same distinct populations are visible, and a similar distribution is summarized in Table 1 for all light exposure levels. Even when the same method was applied to images exposed at 0.2%, the values for cell count and cells in the G1 and G2 states are almost identical.
At the lowest exposure level (0.05%), the dynamic range is reduced even further. At this exposure, the distinct populations are no longer clearly visible (Figure 8, bottom right), and, as a result, the cell count is underestimated by about 4% while the percentage of cells in G2 is overestimated by about 1%. This indicates that when high-precision measurements are required, the SNR limit for successful analysis has been reached. However, the results can be used for a rough estimate, even with this ultra-low light exposure.

Figure 8
scanR scatter plots: Cell cycle diagrams derived from images with an optimal SNR (100% light exposure) and reduced SNR (2%, 0.2%, and 0.05% light exposure, respectively). Note the different scaling of the y-axis.
Measurement Results Derived at Different Light Exposure Levels
| Light exposure | 100% | 2% | 0.2% | 0.05% |
|---|---|---|---|---|
| Detected nuclei count | 11072 | 11015 | 11007 | 10595 |
| G1 state | 63.9% | 63.9% | 63.8% | 63.2% |
| G2 state | 36.1% | 36.1% | 36.2% | 36.8% |
Conclusions
Quantitative analysis of fluorescence images of nuclei is a basic technique for many areas of life science research. Automated detection using TruAI can save time and improve reproducibility. However, the method needs to be robust and should produce reliable results even when the fluorescence signal is low
Olympus’ TruAI enables reliable detection of nuclei at a range of SNR levels. The results presented here show that the convolutional neural networks of TruAI can deliver robust results with as little as 0.2% of the light usually required. Therefore, the new technology can ease fast, robust quantitative analysis of a large number of images under challenging light conditions. The dramatic decrease in light exposure a minimum influence on cell viability and enables fast data acquisition and long-term observation of living cells.
Author
Dr. Mike Woerdemann,
Dr. Matthias Genenger
Product Manager
Olympus Soft Imaging Solutions GmbH
Münster, Germany
*1 [Long et al. 2014: Fully Convolutional Networks for Semantic Segmentation ]
Sorry, this page is not
available in your country.