The absorption and transmission characteristics of Kodak Wratten filters are published in the Kodak Photographic Filters Handbook (Publication No. B-3), which includes tabulations of spectral data at various wavelengths. A typical visible light absorption spectrum for one of these filters, the Wratten number 34a, is illustrated in Figure 1. In this figure, absorption (diffuse density) is plotted as a function of wavelength from 300 to 700 nanometers.
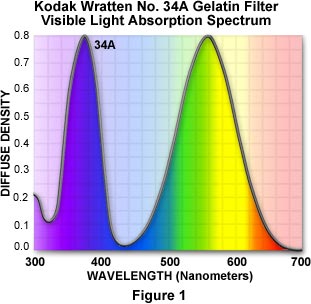
The 34a filter has a strong absorption band at 370 nanometers, in the ultraviolet region of the spectrum, and another centered at 560 nanometers in the green-yellow transition region of the visible spectrum. This filter passes or transmits wavelengths whose diffuse density is less than 0.1, so the wavelength ranges transmitted by the 34a filter are 410 to 470 nanometers (blue light) and 660 to 700 nanometers (red light).
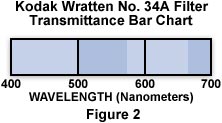
The transmission bands of filters are conveniently represented as a bar graph, such as the one illustrated in Figure 2. The darker areas represent regions of transmission by the filter that exceed 10 percent, and the lighter areas represent wavelengths blocked by the filter. This type of graph provides a simple index for comparing a set of filters to quickly determine the suitable filter for any particular application.
A compilation of bar charts for the common Kodak Wratten color filters are listed in Table 1. Use this table as a reference in choosing filters to enhance contrast in stained specimens using black & white photomicrography.
The absorption and transmission characteristics of common biological stains are published in the Sigma-Aldrich Handbook of Stains, Dyes, and Indicators and H. J. Conn's Biological Stains, which include actual spectroscopic data for hundreds of dyes. Typical visible light absorption spectra for red (Congo Red), green (Malachite Green), and blue (Methylene Blue) dyes are presented in Figure 1. In this figure, absorption (diffuse density) is plotted as a function of wavelength from 300 to 700 nanometers.
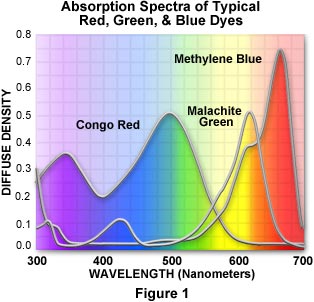
Congo Red has a strong absorption band at 340 nanometers in the near-ultraviolet region and another at 500 nanometers near the blue-green transition region. This dye transmits red wavelengths above 560 nanometers and thus, appears red to the eye. Appearing visually as a green dye, Malachite Green has a strong absorption band centered at 600 nanometers near the yellow-red transition region, with a wide transmission band (passing blue and green light) between 400 and 550 nanometers. Methylene blue has a strong absorption band centered at 660 nanometers, in the red region of the visible spectrum, and transmits wavelengths below 600 nanometers, bestowing a blue color to the dye.
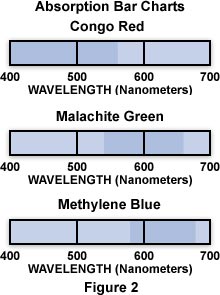
When the diffuse density (absorption) by a stain exceeds 0.1, the wavelength band falling within the region greater than 0.1 is considered absorbed. This can conveniently be represented as a bar graph, such as the ones illustrated in Figure 2. The darker areas represent regions of absorption by the dyes that exceed a diffuse density of 0.1, and the lighter areas represent wavelengths passed (not absorbed) by the dye. This type of graph provides a simple index for comparing a set of dyes to quickly determine the suitable dye for any particular staining application.
A compilation of bar charts for the common biological stains are listed in Table 1. Use this table as a reference in choosing dyes to stain biological specimens for photomicrography using black & white film.
| SPECTRAL ABSORPTION CHARACTERISTICS OF COMMON BIOLOGICAL STAINS | |||
| Stain | Spectral Absorption | ||
| Acid Fuchsin | 530-560 | ||
| Aniline Blue | 550-620 | ||
| Azure B | 580+ | ||
| Azure C | 580-640 | ||
| Basic Fuchsin | 520-570 | ||
| Brilliant Cresyl Blue | 550+ | ||
| Carmine | 500-570 | ||
| Congo Red | 400-560 | ||
| Crystal Violet | 550-610 | ||
| Darrow Red | 450-550 | ||
| Eosin Y | 490-530 | ||
| Erythrosin B | 510-540 | ||
| Ethyl Eosin | 530-550 | ||
| Fast Green | 560+ | ||
| Giemsa | 500+ | ||
| Light Green SF | 590+ | ||
| Luxol Fast Blue | 500-640 | ||
| Methyl Green | 560+ | ||
| Methylene Blue | 590+ | ||
| Neutral Red | 480-570 | ||
| Nigrosin | 450+ | ||
| Nuclear Fast Red | 460-550 | ||
| Orange G | 450-510 | ||
| Orcein | 500-620 | ||
| Phloxine B | 520+ | ||
| Prussian Blue | 560+ | ||
| Pyronin B | 510-560 | ||
| Saffron | 350-480 | ||
| Safranin O | 470-550 | ||
| Sudan IV | 470-580 | ||
| Sudan Red | 450-590 | ||
| Tartrazine | 400-460 | ||
| Toluidine Blue | 560+ | ||
| Trypan Blue | 500+ | ||
| Wright's | 500+ | ||
| Nanometers | 400 | 500 | 600 |
| < UltravioletInfrared > | |||