Yeast Protein Localization Classified Using TruAI™ Deep-Learning Technology
Putting Artificial Intelligence (AI) to the Test
Artificial intelligence (AI) technology is helping alleviate the manual burden of researchers who need to process high volumes of microscopy imaging data. A trained TruAI™ deep-learning neural network enables automatic object segmentation of complex data sets, but how adaptable and efficient is it? This application note validates TruAI
technology’s performance for a particularly challenging application, high-content assays classifying protein localization in yeasts.
The Challenge: High-Content Fluorescence Screening to Classify Yeasts
Knowing the subcellular location of proteins is a key prerequisite to understanding their biological function. To examine where proteins are located in the model organism Saccharomyces cerevisiae (from here on, yeast), scientists developed comprehensive collections of mutants across the genome. These mutants have proteins that can be labeled with a fluorescent marker at either the N- [1,2] or C-terminus [3,4]. This allows researchers to observe the mutant protein’s location under a microscope by studying its fluorescent pattern (see Figure 1).
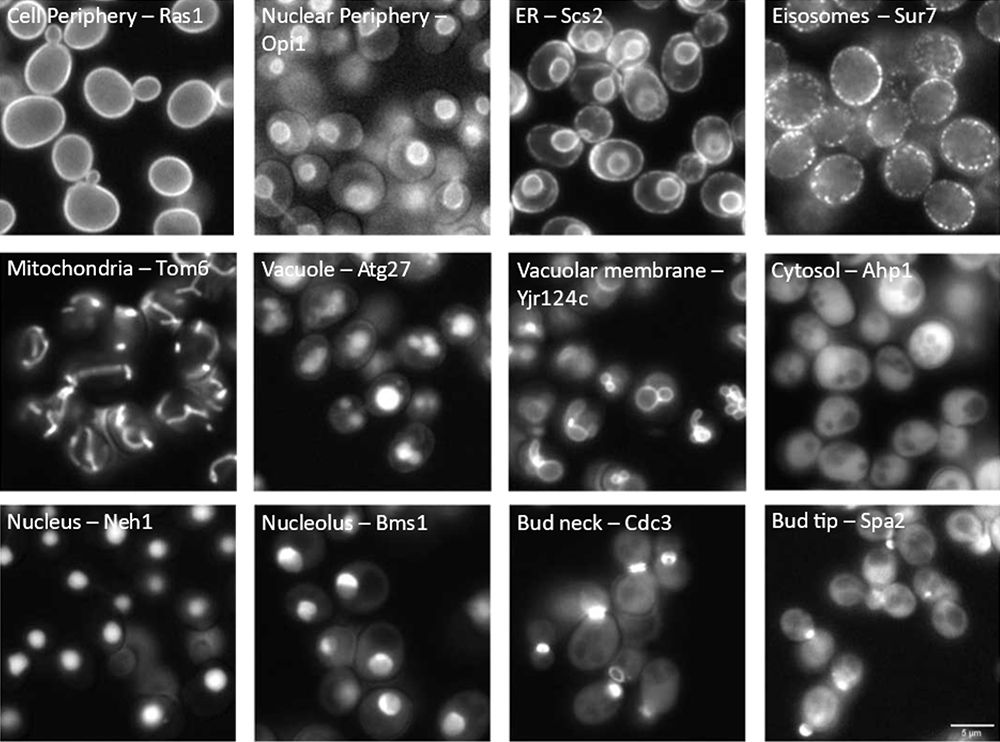
Figure 1: Cell compartment localization of fluorescently tagged proteins in yeast. The visualized compartment (left) and the standard name of each tagged protein (right) are labeled in each image.
Yeasts have around 6000 genes in total. Therefore, these genome-wide mutant collections require around 6000 individual mutant strains. High-content approaches have been developed that enable the simultaneous genetic manipulation of thousands of yeast strains to create collections tailored to specific scientific questions, for example, by introducing a gene deletion into a genome-wide fluorescent mutant collection or by introducing a second fluorescent marker to assess spatial relationships between different proteins. Streamlined approaches are available for the efficient handling of such large mutant collections, and for their image acquisition by automated microscopy [5]. But a bottleneck in these high-content assays is the analysis of the large amounts of image data generated to determine the protein localization according to the fluorescence pattern.
In this application note, we will showcase the use of TruAI™ deep learning technology in combination with the scanR high content screening platform to create an AI model based on the fluorescence pattern to automatically classify the protein localization in different cellular compartments, for various yeast strains (Figure 1).
Ground Truth Annotations and AI Training
For the development of any AI model, the first step is the creation of ground truth that relates a specific pixel pattern of an image to a specific class. For standard image segmentation tasks, this can be easily achieved by manual annotations using software labelling tools [6]. However, the more classes the model needs to discern, the more ground truth annotations are needed, resulting in increased user annotation effort, and making manual annotations inefficient and tedious.
The task becomes even more challenging when the aim is to create a model that can generalize effectively across a large variety of strains and that can adapt to variations in imaging conditions. These variations encompass aspects such as focus quality, fluorescence contrast, signal-to-noise ratio, etc., all of which must be adequately accounted for within the annotations.
To address this challenge, we employed a smart sample preparation method in conjunction with scanR high content screening software, which seamlessly integrates TruAI tools. This software streamlines the automated assignment of ground truth annotations, simplifying the process significantly.
We used a 384 well plate to prepare and image different mutant strains expressing fluorescently labeled proteins for which the localization was known. We chose several representatives for a total of 12 localizations: cell periphery, nuclear periphery, endoplasmic reticulum (ER), eisosomes, mitochondria, vacuole, vacuolar membrane, cytosol, nucleus, nucleolus, bud neck, and bud tip. To generate phenotypic variability within each localization class, multiple independent strains were selected for each localization, resulting in a total of 133 strains used for training (Figure 2).
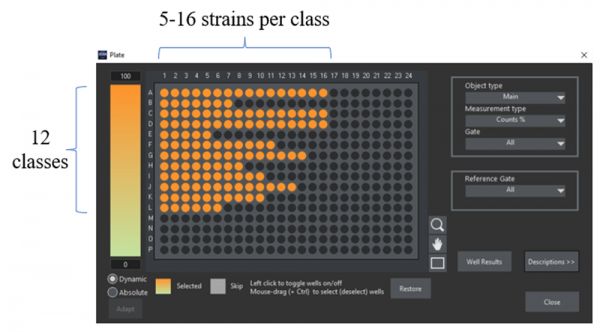
Figure 2: 384 well plate layout of the ground truth sample preparation. Each well corresponds to a strain in which a specific protein was tagged with GFP at its N-terminus. All strains of the same row share the same protein localization and were assigned to ground truth of the same class.
Imaging was carried out using a scanR widefield microscope and a 40x air objective (NA 0.95). To identify single yeast cells, segmentation was performed in the transmission channel by using an inbuilt pretrained AI model from the software [7] (Figure 3). To exclude artifacts and abnormal cells, the resulting objects were filtered by circularity factor and area. All segmentation masks are automatically stored in a single file that contains parameter information for each single segmented yeast, including the well where it belongs to (i.e., the class and strain) and if they were filtered as normal or abnormal cells. This file is used within the scanR software’s TruAI interface to create ground truth annotations for the 12 classes of normal cells. All pixels filtered as abnormal cells are ignored for the training. In this way, 4000–15,000 individual annotations were obtained for each class, covering different strains, and a range of typical image variations (focus, image contrast, signal intensity, cell debris, etc.).
After all the segmentations were done and the ground truth was assigned, the TruAI training configuration was set. We chose the options Generalizing Network and Semantic Segmentation, enabled pixel class overlap, and trained for 350 000 iterations.
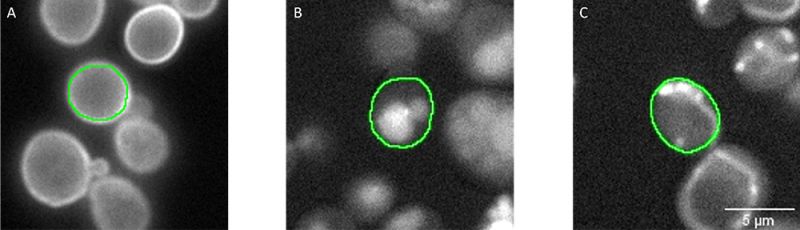
Figure 3: Segmentation masks (green) of individual cells segmented in the transmission channel (not shown). Fluorescent signals represent proteins localizing in A) the cell periphery (well 60, C12), B) the vacuole (well 266, L2), and C) mitochondria (well 147, G3). The ground truth annotations were assigned automatically in the scanR software by combining the segmentation mask, the fluorescence channel, and the well number.
Results and Validation of the AI-Based Classification Solution
To assess its real-world performance, the model was evaluated using an independent dataset that had not been included in the training. We prepared a novel 384 well plate with strains expressing fluorescently tagged proteins belonging to the 12 protein localization classes. After imaging in transmission and fluorescence, we performed an automated analysis in the scanR software by applying two AI models: an inbuilt pretrained AI model for the detection of cells in transmission, and our new model for the classification of protein localizations according to the fluorescence pattern. To quickly visualize the performance results, heat maps can be created in the software displaying in each well the percentage of cells with a high probability for a specific class, and galleries of those single cells can be generated, as exemplified for the identification of proteins localizing to nucleoli (Figure 4).
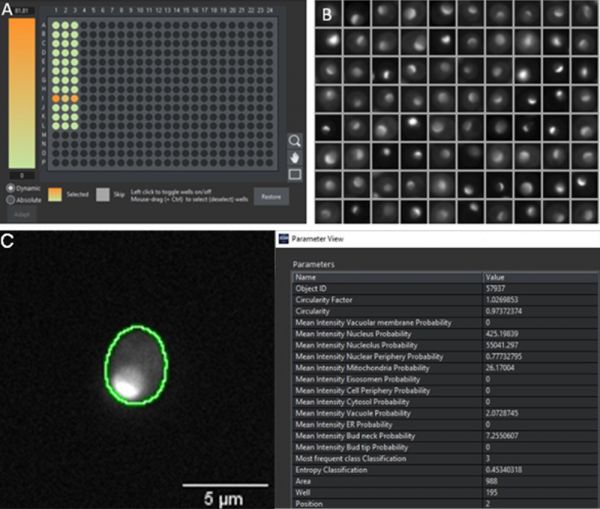
Figure 4: A) Heatmap across a 384 well plate displaying the probability of the cells in the well belonging to the nucleolus class. The heat map indicates that the proteins only locate to the nucleolus in row I. B) Gallery of segmented objects with high nucleolus probability to visually confirm a fluorescence pattern corresponding to a nucleolus localization (compare to Figure 1). C) Segmented cell in well I3 with a set of extracted parameters from the segmentation mask. In this example, the nucleolus has the highest value (55041), which is more than 100 times higher than the second highest scoring class (nucleus, value 425).
To achieve a more precise assessment of the model performance, we compared the AI classification prediction to the ground truth annotations, which was depicted in a confusion matrix (Figure 5).
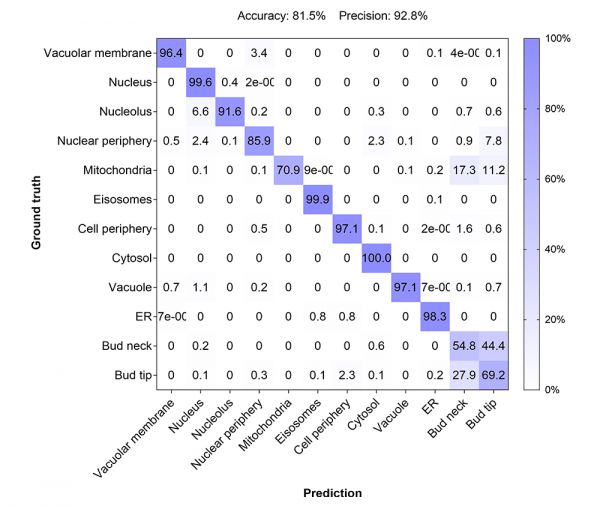
Figure 5: Confusion matrix to assess the performance of the developed AI model by comparing the predicted classes with the true classes (1600 – 4000 individual cells per class).
The matrix rendered an overall accuracy of 81.5% and a precision of 92.8% defined as:
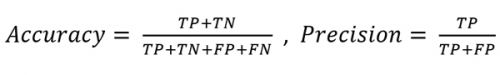 |
TP: True positives
|
The model showed a robust performance for all protein localizations except for the classes bud neck and bud tip. While the model predicted that the location was either at the bud neck or bud tip, it had difficulties distinguishing between the two localizations. This limitation might have a biological basis, as proteins of the two classes display a considerable overlap in localization depending on the cell cycle stage (see Figure 1).
Conclusion: Advantages of AI High-Content Screening Yeast Protein Localization
We showed that by smart sample preparation and automated assignment of ground truth to thousands of cells, it was possible to develop an AI deep-learning model capable of accurately predicting 10 different classes of protein localizations in yeast. This methodology can be applied to other complex classification trainings and offers the following advantages: 1) it does not require any software programing skills of the user, 2) it saves time by avoiding tedious manual annotations, and 3) it has,
due to broad ground truth annotation, the potential to produce AI classification networks robust to imaging variations, making them suitable to be applied by batch to many samples, including in high content screening applications.
References
- Yofe, I. et al. (2016) One library to make them all: streamlining the creation of yeast libraries via a SWAp-Tag strategy. Nat. Methods 13, 371–378
- Weill, U. et al. (2018) Genome-wide SWAp-Tag yeast libraries for proteome exploration. Nat. Methods 15, 617–622
- Huh, W.-K. et al. (2003) Global analysis of protein localization in budding yeast. Nature 425, 686–91
- Meurer, M. et al. (2018) Genome-wide C-SWAT library for high-throughput yeast genome tagging. Nat. Methods 15, 598–600
- Cohen, Y. and Schuldiner, M. (2011) Advanced methods for high-throughput microscopy screening of genetically modified yeast libraries. Methods Mol. Biol. 781, 127–59
- https://www.olympus-lifescience.com/en/applications/rapid-automated-detection-and-segmentation-of-glomeruli-using-self-learning-ai-technology/
- https://www.olympus-lifescience.com/en/discovery/20-examples-of-effortless-nucleus-and-cell-segmentation-using-pretrained-deep-learning-models/
University of Münster Authors:
Julian Schmidt, Sarah Weischer, Mike Wälte, Jens Wendt, Thomas Zobel, and Maria Bohnert
Evident Author:
Manoel Veiga, Application Specialist, Evident Technology Center Europe
适于这类应用的产品
对不起,此内容在您的国家不适用。