Fluorescence Filter Spectral Transmission Profiles
Fluorescence microscopes are equipped with a combination of three essential filters (often termed a filter set) that are positioned in the optical pathway between the light source in the vertical illuminator and the objective. The filters are strategically oriented within a specialized cube or block that enables the illumination to enter from one side and pass to and from the specimen in defined directions along the microscope optical axis.
Because of their novel electronic configurations, fluorochromes have unique and characteristic spectra for absorption (usually similar to excitation) and emission. These absorption and emission spectra show relative Intensity of fluorescence, with the relative intensity classically plotted on the vertical axis versus wavelength on the horizontal axis. For a given fluorochrome, the manufacturers indicate the wavelength for the peak of the illumination excitation intensity and the wavelength for the peak of fluorescence emission intensity. It is important to understand the origin of the graphs and curves displaying the excitation and emission spectra for a given fluorochrome.
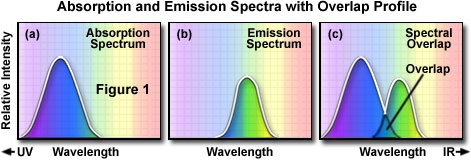
In order to determine the emission spectrum of a particular fluorochrome, the wavelength of maximum absorption (usually the same as the excitation maximum) is determined and the fluorochrome is excited at that wavelength. The absorption spectrum of a typical fluorochrome is illustrated in Figure 1(a) where the relative intensity of absorption is plotted against the measured wavelength. A monochromator (a device that allows narrow bands of light wavelengths to pass) is then used to scan the fluorescence emission intensity over the entire series of emission wavelengths. The relative intensity of the fluorescence is measured at the various wavelengths to plot the emission spectrum, as illustrated in Figure 1(b). The excitation spectrum of a given fluorochrome is determined in a similar manner by monitoring fluorescence emission at the wavelength of maximum intensity while the fluorophore is excited through a group consecutive wavelengths. The emission maximum is chosen and only emission light at that wavelength is allowed to pass to the detector. Excitation is induced (usually by means of a monochromator) at various excitation wavelengths and the intensity of the emitted fluorescence is measured as a function of wavelength. The result is a graph or curve (illustrated in Figure 1(a)), which depicts the relative fluorescence intensity produced by excitation over the spectrum of excitation wavelengths.
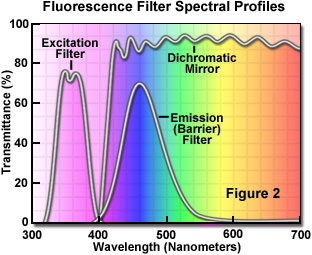
The separation of excitation and emission wavelengths is achieved by the proper selection of filters to block or pass specific wavelengths of the spectrum as presented in Figure 2. The design of fluorescence illuminators is based on control of excitation light and emission light by readily changeable filter insertions into the light path on the way toward the specimen and then emanating from the specimen. It is important, in view of low emission intensities, that the light source chosen for excitation be of sufficient brightness so that the relatively weak emission light can be maximized, and that fluorochromes of satisfactory absorption and yield be chosen.
The efficiency with which the fluorochrome absorbs the excitation light is known as the extinction coefficient. The greater the extinction coefficient, the greater the possibility of light absorption in a given wavelength region (a prerequisite to ensuing fluorescence emission). The yield of emitted light is referred to as the quantum yield, the ratio of the number of quanta ("packets" of energy) emitted compared to the number of quanta absorbed (usually the yield is between 0.1 and 0.9). Quantum yields below a value of 1 are the result of the loss of energy through non-radiative pathways (such as heat or a photochemical reaction) rather than the re-radiative pathway of fluorescence.
Sorry, this page is not
available in your country.