Label-Free Transmigration Assay Using scanR TruAI for Self-Learning Microscopy
Introduction
The transmigration of cells from the blood into tissues through vascular endothelium is known as transendothelial migration. Leukocytes in inflammatory tissue, as well as cancer cells, undergo this process in an important step of the metastatic cascade. The extravasation consists of multiple consecutive processes, including the capture of circulating leukocytes, subsequent leukocyte rolling, firm adhesion, and transmigration1 (Figure 1).
 |  |
Figure 1. Representation of the transmigration process. |
The visualization of these events is typically performed with a combination of fluorescence and phase contrast microscopy. Using a flow chamber, the microscope captures video of the migration of fluorescently labeled leukocytes over a monolayer of endothelial cells, where transmigration events can later be recognized by the leukocytes’ change in contrast (Figure 2). The quantification of transmigration is important for investigating the mechanisms involved in this process. This is typically done by hand on the recorded videos—a subjective and labor-intensive procedure2.
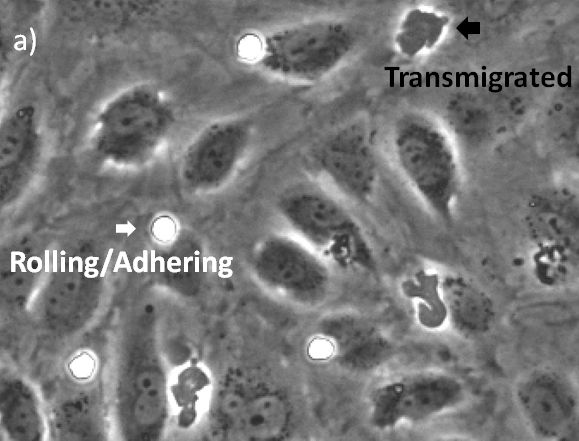 | 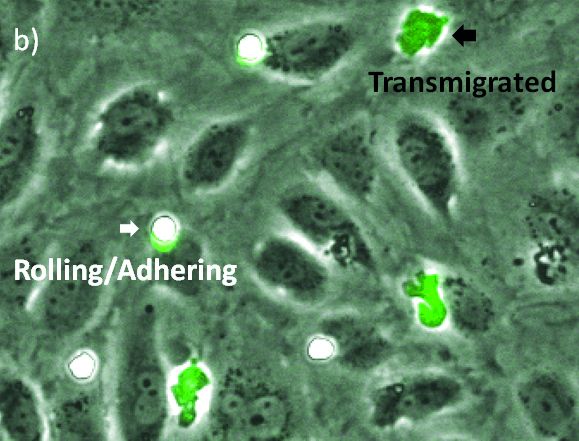 |
Figure 2. a) Phase contrast, b) phase contrast and fluorescence. Round leukocytes in the rolling/adhering state are easily visualized in phase contrast due to their high intensity and round shape (white arrows). Once they transmigrate through the endothelium they become dark and therefore more difficult to identify (black arrows). |
Automated quantification of the transmigration events would be a major benefit, as this method is more objective and helps save time. The basic module of the scanR high-content screening station already enables automatic quantification based on fluorescence images. However, quantifying these processes without the need for a fluorescent signal would be an extra improvement, as fluorescent labels can affect the functionality of leukocytes and thereby the migratory process itself3.
Objectives
In this application note, we show that applying deep learning can significantly simplify the assay because only phase contrast is needed. In addition, we found that the deep-learning results outperform fluorescence-based analysis. The quantification can be done automatically, differentiating two states of the transmigration cascade: 1) the rolling/adhering state prior to transmigration and 2) after the cells have transmigrated through the endothelial monolayer.
To achieve this, a deep neural network can be easily trained to robustly identify these two cellular states in phase contrast using the TruAI deep-learning technology of scanR software. Further, by applying the scanR kinetic module, the method also enabled us to gain dynamic information on the transmigration process.
Self-Learning Microscopy
In a training experiment, fluorescently labeled leukocytes are flown in a microscope chamber slide containing a monolayer of TNFα-stimulated endothelial cells. The transmigration process is recorded in multiple positions of the slide, in phase contrast and fluorescence, in a time-lapse experiment every 25 seconds for 35 minutes.
Using the scanR analysis software, the labeled cells are segmented based on their fluorescence. The detected cells are gated according to their size, shape, and fluorescence intensity, making it possible to differentiate between the two target classes: (class1) rolling/adhering state and (class2) transmigrated state (Figure 3).
Figure 3. Classification of cells in class1 (rolling/adhering state, left) and class2 (transmigrated state, right), according to their geometric size and shape.
Next, each class is used to train a deep neural network to identify both cellular states in the phase contrast channel only.
Applying the Deep Neural Network
The generated deep neural network is applied to the phase contrast images in the two positions of the chamber slide that were not used for the training.
The results, evaluated over thousands of cells, indicate that deep learning even outperforms fluorescence. The reason is that some cells strongly lose fluorescence signal once they transmigrate and therefore cannot be detected automatically (Figure 4).
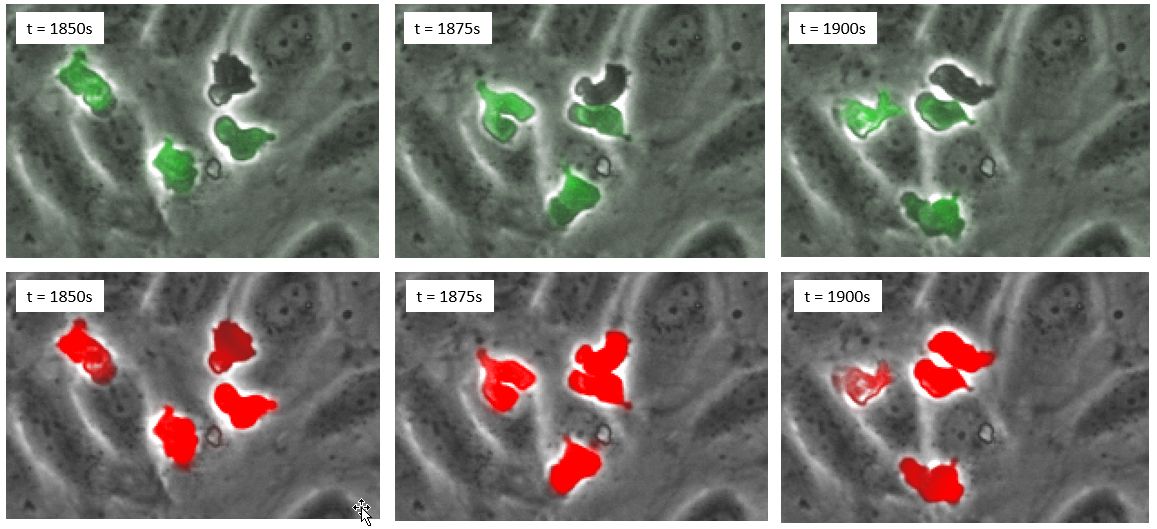
Figure 4. (Top row) time series in phase contrast and fluorescence; (bottom row), time series in phase contrast and deep learning prediction in red.
Once we confirmed that the deep neural network outperforms fluorescence for the detection of the leukocytes, there was no need to label them with fluorescence. As a result, we generated a new and independent dataset with a new experiment where the leukocytes were not fluorescently labeled. The same deep neural network was then applied to the phase contrast images to identify both cell states over time (Figure 5).
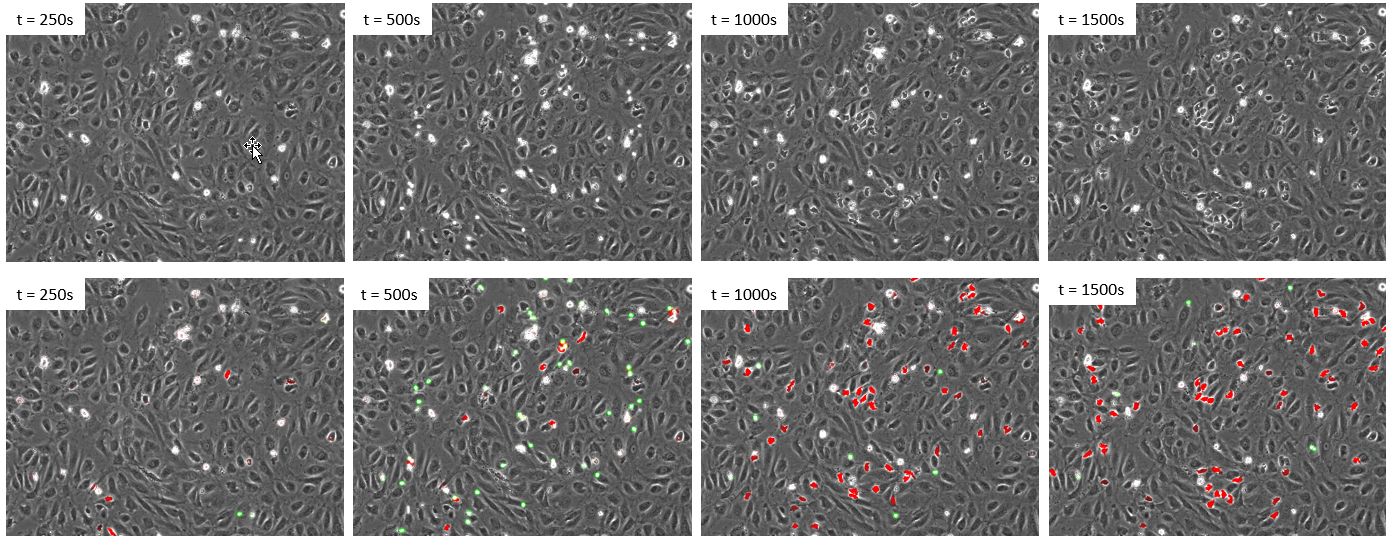
Figure 5. Time lapse of a new dataset where the leukocytes were not labelled with fluorescence. Upper panels: phase contrast. Lower panels: phase contrast and deep learning prediction of class1 cells (green) and class2 cells (red).
Visual inspection confirms that the deep neural network enables a reliable detection of both states of cells using only phase contrast. Next, the rate of transmigration is evaluated by plotting the total number of cells of each state over time (Figure 6).
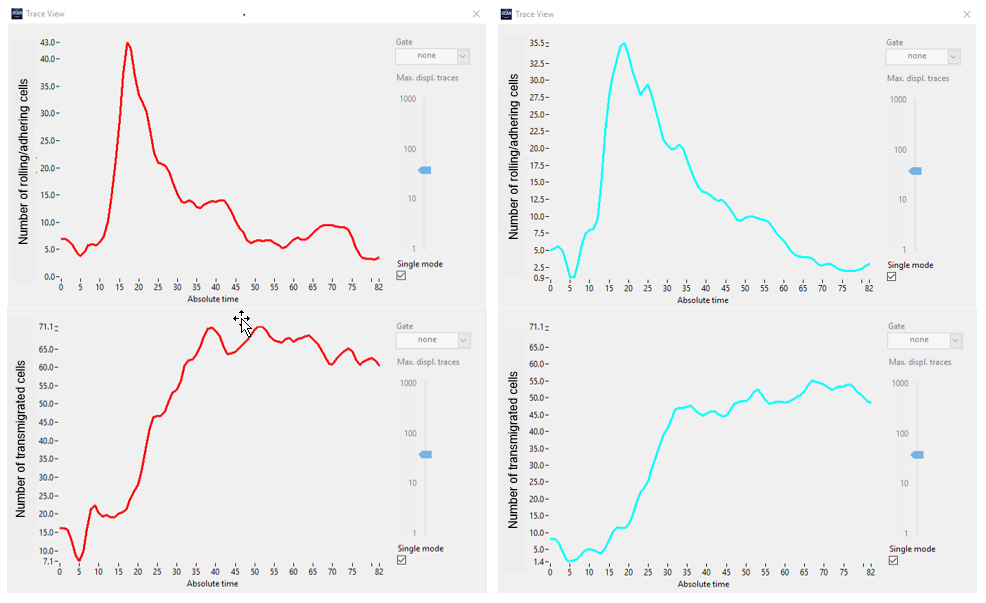
Figure 6. Number of cells in class1 (rolling/adhering, top) and class2 (transmigrated, bottom) in two different sets of experiments (red vs. cyan).
Additionally, the kinetic module from the scanR system was used to track individual cells and follow the transmigration process over time (Figure 7).

Figure 7. Individual cells were tracked and their parameters plotted over time to gain information about the dynamics of the transmigration cascade. a) Probability of a cell to belong to the rolling/adhering state over time. b) Probability of a cell to belong to the transmigrated state over time. c) Direction of motion over time. d) Speed of motion over time. e) Trajectory of a cell tracked over time. f) Time series every 25 s of the same cell presented in e). Highlighted tracks in a) b) c) and d) (in red) correspond to the cell represented in e).
The kinetic curves of individual cells show that before transmigration the cells slow down their motion and remain static for the transmigration event, which lasts 3 time points (75 s). Then the transmigrated cells move freely again for the rest of the experiment underneath the endothelial monolayer.
Conclusion
This novel deep-learning approach of analyzing the transmigration assay enabled us to acquire much more information than was previously possible with automation and without the need for staining. It also enabled us to discriminate between adherent and transmigrating cells in a fast and reliable manner that outperforms fluorescence. The kinetic analysis enabled us to look at the dynamics of this process in great detail for individual cells. The method described above gives clear insight into the speed of the transmigration event and the percentage of transmigrated cells over time.
References
1. Vestweber, D. How Leukocytes Cross the Vascular Endothelium. Nat Rev Immunol 15, 692–704 (2015). Doi:10.1038/nri3908.
2. Kroon J, Daniel, AE, Hoogenboezem M, Van Buul JD. Real-time Imaging of Endothelial Cell-cell Junctions During Neutrophil Transmigration Under Physiological Flow. J. Vis. Exp. (90), e51766, (2014). Doi:10.3791/51766. https://www.jove.com/video/51766/real-time-imaging-endothelial-cell-cell-junctions-during-neutrophil
3. Nolte MA, Kraal G, Mebius RE. Effects of Fluorescent and Nonfluorescent Tracing Methods on Lymphocyte Migration in Vivo. Cytometry A, 61 (1), 35-44, (2004). Doi: 10.1002/cyto.a.20074.
Authors
M. Hoogenboezem and M. A. Nolte,
Research Facility, Department of Molecular and Cellular Hemostasis, Sanquin Research, Amsterdam, The Netherlands
E. G. G. Sprenkeler
Department of Blood Cell Research, Sanquin Research, Amsterdam, The Netherlands
Manoel Veiga Gutierrez
Application Specialist, Olympus Soft Imaging Solutions GmbH, Johann-Krane-Weg 39 48149 Münster, Germany.
Produits utilisés pour cette application
Sorry, this page is not
available in your country.