Fluorescence Resonance Energy Transfer (FRET) Microscopy
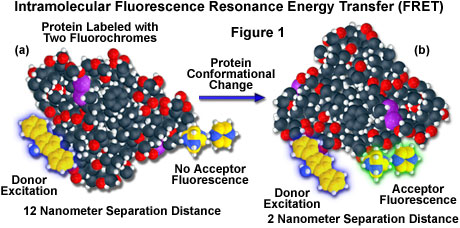
The precise location and nature of the interactions between specific molecular species in living cells is of major interest in many areas of biological research, but investigations are often hampered by the limited resolution of the instruments employed to examine these phenomena. Conventional widefield fluorescence microscopy enables localization of fluorescently labeled molecules within the optical spatial resolution limits defined by the Rayleigh criterion, approximately 200 nanometers (0.2 micrometer). However, in order to understand the physical interactions between protein partners involved in a typical biomolecular process, the relative proximity of the molecules must be determined more precisely than diffraction-limited traditional optical imaging methods permit. The technique of fluorescence resonance energy transfer (more commonly referred to by the acronym FRET), when applied to optical microscopy, permits determination of the approach between two molecules within several nanometers (see Figure 1), a distance sufficiently close for molecular interactions to occur.
Typical fluorescence microscopy techniques rely upon the absorption by a fluorophore of light at one wavelength (excitation), followed by the subsequent emission of secondary fluorescence at a longer wavelength. The excitation and emission wavelengths are often separated from each other by tens to hundreds of nanometers. Labeling of cellular components, such as the nuclei, mitochondria, cytoskeleton, Golgi apparatus, and membranes, with specific fluorophores enables their localization within fixed and living preparations. By simultaneously labeling several sub-cellular structures with individual fluorophores having separated excitation and emission spectra, specialized fluorescence filter combinations can be employed to examine the proximity of labeled molecules within a single cell or tissue section. With this technique, molecules that are closer together than the optical resolution limit appear to be coincident, and this apparent spatial proximity implies that a molecular association is possible. In most cases, however, the normal diffraction-limited fluorescence microscope resolution is insufficient to determine whether an interaction between biomolecules actually takes place. Fluorescence resonance energy transfer is a process by which radiationless transfer of energy occurs from an excited state fluorophore to a second chromophore in close proximity. Because the range over which the energy transfer can take place is limited to approximately 10 nanometers (100 angstroms), and the efficiency of transfer is extremely sensitive to the separation distance between fluorophores, resonance energy transfer measurements can be a valuable tool for probing molecular interactions.
The mechanism of fluorescence resonance energy transfer involves a donor fluorophore in an excited electronic state, which may transfer its excitation energy to a nearby acceptor chromophore in a non-radiative fashion through long-range dipole-dipole interactions. The theory supporting energy transfer is based on the concept of treating an excited fluorophore as an oscillating dipole that can undergo an energy exchange with a second dipole having a similar resonance frequency. In this regard, resonance energy transfer is analogous to the behavior of coupled oscillators, such as a pair of tuning forks vibrating at the same frequency. In contrast, radiative energy transfer requires emission and reabsorption of a photon and depends on the physical dimensions and optical properties of the specimen, as well as the geometry of the container and the wavefront pathways. Unlike radiative mechanisms, resonance energy transfer can yield a significant amount of structural information concerning the donor-acceptor pair.
Resonance energy transfer is not sensitive to the surrounding solvent shell of a fluorophore, and thus, produces molecular information unique to that revealed by solvent-dependent events, such as fluorescence quenching, excited-state reactions, solvent relaxation, or anisotropic measurements. The major solvent impact on fluorophores involved in resonance energy transfer is the effect on spectral properties of the donor and acceptor. Non-radiative energy transfer occurs over much longer distances than short-range solvent effects, and the dielectric nature of constituents (solvent and host macromolecule) positioned between the involved fluorophores has very little influence on the efficacy of resonance energy transfer, which depends primarily on the distance between the donor and acceptor fluorophore.
The phenomenon of fluorescence resonance energy transfer is not mediated by photon emission, and furthermore, does not even require the acceptor chromophore to be fluorescent. In most applications, however, both donor and acceptor are fluorescent, and the occurrence of energy transfer manifests itself through quenching of donor fluorescence and a reduction of the fluorescence lifetime, accompanied also by an increase in acceptor fluorescence emission. The efficiency of the energy transfer process varies in proportion to the inverse sixth power of the distance separating the donor and acceptor molecules. Consequently, FRET measurements can be utilized as an effective molecular ruler for determining distances between biomolecules labeled with an appropriate donor and acceptor fluorochrome when they are within 10 nanometers of each other.
A hypothetical example of fluorescence resonance energy transfer between two fluorochromes attached to opposite ends of the same macromolecular protein is presented in Figure 1. In the native conformation (Figure 1(a)), the two fluorophores are separated by a distance of approximately 12 nanometers, too far for intramolecular resonance energy transfer between the fluorochromes to occur. However, when the protein is induced to undergo a conformational change (Figure 1(b)), the two fluorochromes are brought much closer together and can now participate in FRET molecular interactions. In the figure, excitation of the donor fluorochrome is indicated by a blue glow around the yellow tri-nuclear aromatic molecule, while the corresponding acceptor emission (Figure 1(b)) is represented by a green glow surrounding the second heterocyclic fluorochrome on the right-hand side of the protein. Energy transfer measurements are often employed to estimate the distances between sites on a macromolecule and the effects of conformational changes on these distances. In this type of experiment, the degree of energy transfer is used to calculate the distance between the donor and acceptor and obtain structural information about the macromolecule.
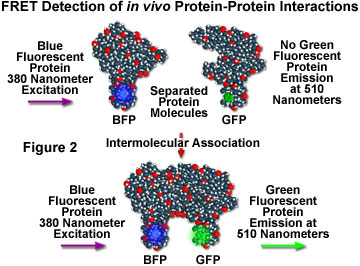
Although fluorescence resonance energy transfer has often been employed to investigate intermolecular and intramolecular structural and functional modifications in proteins and lipids, a major obstacle to implementation of FRET microscopy techniques in living cells has been the lack of suitable methods for labeling specific intracellular proteins with appropriate fluorophores. Cloning of the jellyfish green fluorescent protein (GFP) and its expression in a wide variety of cell types has become a critical key to developing markers for both gene expression and structural protein localization in living cells. Several spectrally distinct mutation variants of the protein have been developed, including a fluorescent protein that emits blue light (blue fluorescent protein, BFP). Both the excitation and emission spectra for the native GFP and BFP mutants are sufficiently separated in wavelength to be compatible with the FRET approach. Figure 2 illustrates the strategy for detection of protein-protein interactions using fluorescence resonance energy transfer and mutant fluorescent proteins. If two proteins, one labeled with BFP (the donor) and the other with GFP (the acceptor), physically interact, then increased intensity at the acceptor emission maximum (510 nanometers) will be observed when the complex is excited at the maximum absorbance wavelength (380 nanometers) of the donor. Failure of the proteins to form a complex results in no acceptor (GFP) fluorescence emission.
Coupled with advances in pulsed lasers, microscope optics, and computer-based imaging technology, the development of labeling techniques in which the donor and acceptor fluorophores are actually part of the biomolecules themselves has enabled the visualization of dynamic protein interactions within living cells. In addition to the investigation of protein partner interactions, recent applications of fluorescence resonance energy transfer include studies of protease activity, alterations in membrane voltage potentials, calcium metabolism, and the conduction of high-throughput screening assays, such as for quantification of gene expression in single living cells.
Principles of Fluorescence Resonance Energy Transfer
The process of resonance energy transfer (RET) can take place when a donor fluorophore in an electronically excited state transfers its excitation energy to a nearby chromophore, the acceptor. In principle, if the fluorescence emission spectrum of the donor molecule overlaps the absorption spectrum of the acceptor molecule, and the two are within a minimal spatial radius, the donor can directly transfer its excitation energy to the acceptor through long-range dipole-dipole intermolecular coupling. A theory proposed by Theodor Förster in the late 1940s initially described the molecular interactions involved in resonance energy transfer, and Förster also developed a formal equation defining the relationship between the transfer rate, interchromophore distance, and spectral properties of the involved chromophores.
Resonance energy transfer is a non-radiative quantum mechanical process that does not require a collision and does not involve production of heat. When energy transfer occurs, the acceptor molecule quenches the donor molecule fluorescence, and if the acceptor is itself a fluorochrome, increased or sensitized fluorescence emission is observed (see Figure 3). The phenomenon can be observed by exciting a specimen containing both donor and acceptor molecules with light of wavelengths corresponding to the absorption maximum of the donor fluorophore, and detecting light emitted at wavelengths centered near the emission maximum of the acceptor. An alternative detection method, growing rapidly in popularity, is to measure the fluorescence lifetime of the donor fluorophore in the presence and absence of the acceptor.
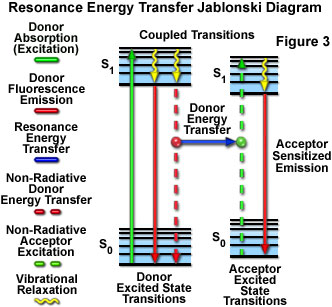
Presented in Figure 3 is a Jablonski diagram illustrating the coupled transitions involved between the donor emission and acceptor absorbance in fluorescence resonance energy transfer. Absorption and emission transitions are represented by straight vertical arrows (green and red, respectively), while vibrational relaxation is indicated by wavy yellow arrows. The coupled transitions are drawn with dashed lines that suggest their correct placement in the Jablonski diagram should they have arisen from photon-mediated electronic transitions. In the presence of a suitable acceptor, the donor fluorophore can transfer excited state energy directly to the acceptor without emitting a photon (illustrated by a blue arrow in Figure 3). The resulting sensitized fluorescence emission has characteristics similar to the emission spectrum of the acceptor.
Several criteria must be satisfied in order for resonance energy transfer to occur. In addition to the overlapping emission and absorption spectra of the donor and acceptor molecules, the two involved fluorophores must be positioned within a range of 1 to 10 nanometers of each other. As described in equations derived by Förster (and discussed below), the energy transfer efficiency between donor and acceptor molecules decreases as the sixth power of the distance separating the two. Consequently, the ability of the donor fluorophore to transfer its excitation energy to the acceptor by non-radiative interaction decreases sharply with increasing distance between the molecules, limiting the FRET phenomenon to a maximum donor-acceptor separation radius of approximately 10 nanometers. At distances less than 1 nanometer, several other modes of energy and/or electron transfer are possible. The distance dependence of the resonance energy transfer process is the primary basis for its utility in investigation of molecular interactions. In living cell studies involving molecules labeled with donor and acceptor fluorophores, resonance energy transfer will occur only between molecules that are close enough to interact biologically with one another.
An additional requirement for resonance energy transfer is that the fluorescence lifetime of the donor molecule must be of sufficient duration to permit the event to occur. Both the rate (K(T)) and the efficiency (E(T)) of energy transfer are directly related to the lifetime of the donor fluorophore in the presence and absence of the acceptor. According to Förster's theory, and verified experimentally, the rate of energy transfer is given by the equation:
KT = (1/τD) • [R0/r]6
where R(0) is the Förster critical distance, τ(D) is the donor lifetime in the absence of the acceptor, and r is the distance separating the donor and acceptor chromophores. The Förster critical distance (R(0)) is defined as the acceptor-donor separation radius for which the transfer rate equals the rate of donor decay (de-excitation) in the absence of acceptor. In other words, when the donor and acceptor radius (r) equals the Förster distance, then the transfer efficiency is 50 percent. At this separation radius, half of the donor excitation energy is transferred to the acceptor via resonance energy transfer, while the other half is dissipated through a combination of all the other available processes, including fluorescence emission.
Conceptually, the Förster critical distance is the maximal separation length between donor and acceptor molecules under which resonance energy transfer will still occur. The critical distance value typically falls within a range of 2 to 6 nanometers, which is fortuitously on the order of many protein molecular dimensions. In addition, the critical distance range also corresponds to several other biologically significant dimensions, such as cell membrane thickness and the distance separating sites on proteins having multiple subunits. The value of R(0) (in nanometers) may be calculated from the following expression:
R0 = 2.11 × 10⁻² • [κ2 • J(λ) • η-4 • QD]1/6
in which κ-squared is a factor describing the relative orientation in space between the transition dipoles of the donor and acceptor, J(λ) is the overlap integral in the region of the donor emission and acceptor absorbance spectra (with the wavelength expressed in nanometers), η represents the refractive index of the medium, and Q(D) is the quantum yield of the donor.
The efficiency of energy transfer, E(T), is a measure of the fraction of photons absorbed by the donor that are transferred to the acceptor, and is related to the donor-acceptor separation distance, r, by the equation:
r = R0 • [(1/ET) - 1]1/6
and E(T) is evaluated as:
ET = 1 - (τDA/τD)
where τ(DA) is the donor lifetime in the presence of the acceptor and τ(D) is the donor lifetime in the absence of the acceptor. Therefore, by measuring the donor fluorescence lifetime in the presence and absence of an acceptor (which is indicative of the extent of donor quenching due to the acceptor), it is possible to determine the distance separating donor and acceptor molecules. In many commonly applied techniques, the energy transfer efficiency is determined by steady state measurements of the relative average donor fluorescence intensities in the presence and absence of the acceptor (not by measuring the lifetimes).
In summary, the rate of energy transfer depends upon the extent of spectral overlap between the donor emission and acceptor absorption spectra (see Figure 4), the quantum yield of the donor, the relative orientation of the donor and acceptor transition dipole moments, and the distance separating the donor and acceptor molecules. Any event or process that affects the distance between the donor and acceptor will affect the resonance energy transfer rate, consequently allowing the phenomenon to be quantified, provided that artifacts can be controlled or eliminated.
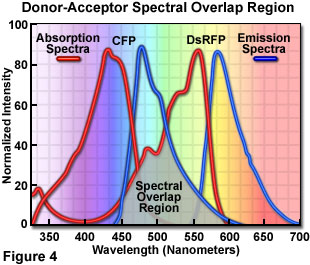
Presented in Figure 4 are the absorption and emission spectra of cyan fluorescent protein (CFP, the donor) and red fluorescent protein (RFP or DsRed, the acceptor) when compared for their potential application as a fluorescence resonance energy transfer pair. Absorption spectra for both biological peptides are illustrated as red curves, while the emission spectra are presented as blue curves. The region of overlap between the donor emission and acceptor absorption spectra is represented by a gray area near the base of the curves. Whenever the spectral overlap of the molecules is increased too far, a phenomenon known as spectral bleed-through or crossover occurs in which signal from the excited acceptor (arising from excitation illumination of the donor) and the donor emission are detected in the acceptor emission channel. The result is a high background signal that must be extracted from the weak acceptor fluorescence emission.
The basic theory of non-radiative energy transfer is directly applicable to a donor-acceptor pair separated by a fixed distance, in which case the rate of energy transfer is a function of the Förster distance, R(0), which in turn depends upon κ-squared, J(λ), η, and Q(D). If these factors are known, the distance between the donor and acceptor can be calculated. More complex formulations are required to describe situations such as multiple acceptor chromophores and distance distributions. Presented in Table 1 are a series of experimentally measured Förster critical distances, which were ascertained from the spectral overlap of several popular donor-acceptor fluorophore pairs. Because the variable includes the donor quantium yield and the degree of spectral overlap, both of which depend on the localized environmental conditions, Förster distance values should be determined under identical experimental conditions as those employed to investigate resonance energy transfer.
The refractive index of the energy transfer medium is generally known from the solvent composition, or can be estimated for a particular macromolecule, and is commonly taken to be 1.4 in aqueous solution. The quantum yield of the donor is determined by comparison to standard fluorophores with known quantum yield. Because Q(D) appears as the sixth-root in the calculation of R(0), small errors or uncertainties in the value of Q(D) do not have a large effect on the Förster distance calculation. Also due to the sixth-root dependence, R(0) is not largely affected by the variations in J(λ), but the overlap integral must still be evaluated for each donor-acceptor pair. In general, higher degrees of overlap between the donor emission spectrum and the acceptor absorption spectrum yield larger Förster critical distance values.
Förster Critical Distance for Common RET Donor-Acceptor Pairs
| Donor | Acceptor | Förster Distance(Nanometers) |
|---|---|---|
| Tryptophan | Dansyl | 2.1 |
| IAEDANS (1) | DDPM (2) | 2.5 - 2.9 |
| EBFP | DsRFP | 3.1 - 3.3 |
| Dansyl | FITC | 3.3 - 4.1 |
| Dansyl | Octadecylrhodamine | 4.3 |
| ECFP | EGFP | 4.7 - 4.9 |
| CF (3) | Texas Red | 5.1 |
| Fluorescein | Tetramethylrhodamine | 4.9 - 5.5 |
| Cy3 | Cy5 | >5.0 |
| EGFP | EYFP | 5.5 - 5.7 |
| EGFP | Alexa Fluor 546 | 5.7 |
| EGFP | Alexa Fluor 555 | 6.3 |
| EGFP | Alexa Fluor 568 | 5.4 |
| EGFP | Alexa Fluor 594 | 5.3 |
| BODIPY FL (4) | BODIPY FL (4) | 5.7 |
| Rhodamine 6G | Malachite Green | 6.1 |
| FITC | Eosin Thiosemicarbazide | 6.1 - 6.4 |
| B-Phycoerythrin | Cy5 | 7.2 |
| Cy5 | Cy5.5 | >8.0 |
(1) 5-(2-iodoacetylaminoethyl)aminonaphthalene-1-sulfonic acid
(2) N-(4-dimethylamino-3,5-dinitrophenyl)maleimide
(3) carboxyfluorescein succinimidyl ester
(4) 4,4-difluoro-4-bora-3a,4a-diaza-s-indacene
Table 1
The uncertainty in evaluating the orientation factor (κ-squared) has been discussed extensively in the literature, and in spite of experimental evidence that the Förster theory is valid and applicable to distance measurement, this variable has continued to be somewhat controversial. It is important to recognize that Förster distances are usually given for an assumed value of κ-squared, typically the dynamically averaged value of 2/3 (0.67). This assumed value results from randomization of donor and acceptor orientation by rotational diffusion prior to energy transfer. The orientation factor depends upon the relative orientations in space of the donor emission dipole and the acceptor absorption dipole, and can range from zero to 4. A value of 1 corresponds to parallel transition dipoles, while a value of 4 results from dipoles that are both parallel and collinear.
Because of the sixth-root relationship to the Förster distance, a variation in the orientation factor from 1 to 4 produces only a 26 percent change in the calculated distance, and a maximum error of 35 percent is possible when the customarily assumed value of 0.67 is applied. The most serious potential error results if the dipoles are oriented exactly perpendicular to each other and the corresponding κ-squared value becomes equal to zero. Several techniques for dealing with the uncertainty have been employed, including the assumption that a range of static orientations exist and do not change during the excited-state lifetime of the fluorophore. Measurements of fluorescence anisotropy for the donor and acceptor can allow limits to be determined for κ-squared variation. In addition, utilization of fluorophores with low fluorescence polarization (due to emission from several overlapping transitions) reduces the uncertainty in orientation factor. Limitation of the possible values of κ-squared in this fashion reduces the potential distance calculation error to perhaps 10 percent.
In many cases, the orientation factor is difficult, if not impossible, to determine and the exact value of the variable is often regarded as an insurmountable problem. However, some evidence indicates a limitation for the importance of the factor in resonance energy transfer calculations. Comparison of donor and acceptor distances using resonance energy transfer spectroscopy and x-ray diffraction techniques largely supports the validity of assuming a value of 0.67 for the factor (as proposed by Förster theory), at least for small peptides and proteins. More uncertainty exists for larger proteins. The use of this value for the orientation factor is valid under the assumption that both donor and acceptor probes are free to undergo unrestricted isotropic motion. Further justification is gained from experimental evidence that for fluorophores attached by a single or double bond to macromolecules, segmental motions of the donor and acceptor tend to result in dynamically randomized orientations.
For loosely bound fluorochromes, free rotational motion around single bonds should enable use of an average orientation value, but unrestricted motion of molecules bound through multiple linkage sites probably does not occur. On the other hand, the extreme values of zero and 4 for κ-squared require complete fluorescence polarization of the donor and acceptor, a condition that is unlikely to be achieved. Statistical calculations have been presented by some investigators that argue the donor-acceptor distribution distances and their orientations determine the observed average distance. Provided that there is some distribution in observed distance (and this is not limited by the donor and acceptor being too close relative to R(0)), the average distance between fluorophores can be reliably obtained and the uncertainty due to orientation factor assessed.
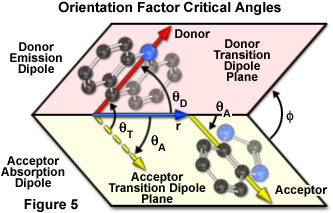
The dependence of the orientation factor (κ-squared) on the relative orientations of the donor emission dipole and the acceptor absorption dipole (illustrated in Figure 5) is given by the equation:
κ2 = (cos θT - 3cos θDcos θA)2 = (sin θD sin θAcos φ - 2cos θDcos θA)2
where θ(T) is the angle between the emission transition dipole of the donor and the absorption transition dipole of the acceptor, θ(D) and θ(A) are the angles between these dipoles and the vector joining the donor and acceptor, and φ is the angle between the planes containing the two transition dipoles.
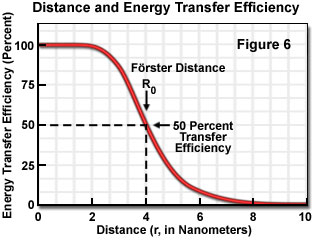
Energy transfer efficiency is most sensitive to distance changes when the donor-acceptor separation length approaches the Förster distance (R(0)) for the two molecules. Figure 6 illustrates the exponential relationship between transfer efficiency and the distance separating the donor and acceptor. The efficiency rapidly increases to 100 percent as the separation distance decreases below R(0), and conversely, decreases to zero when r is greater than R(0). Because of the strong (sixth-power) dependence of transfer efficiency on distance, measurements of the donor-acceptor separation distance are only reliable when the donor and acceptor radius lies within the Förster distance by a factor of two. When r is approximately 50 percent of R(0), the resonance energy transfer efficiency is near the maximum and shorter distances cannot be reliably determined. When the donor-acceptor distance exceeds the R(0) value by 50 percent, the slope of the curve is so shallow that longer separation distances are not resolved.
The practical significance of knowing the critical Förster distance is that the value provides a guide to the range of separation distances that can be determined by FRET for a given pair of probes (see Table 1). Because energy transfer measurement is very sensitive to distance variation when donor-acceptor distances are close to the Förster distance, the approximate dimensions of the target molecular interaction is the most important factor in selecting a fluorescent dye pair. Other factors that should be considered, depending upon whether steady state or time-resolved measurements are being conducted, include chemical stability, quantum yield, and fluorophore decay lifetimes. Since no internal distance reference exists for common fluorescence resonance energy transfer techniques, distances calculated by measuring transfer efficiencies are relative to a Förster distance, which is derived from spectroscopic data measured on the donor-acceptor pairs.
The phenomenon of resonance energy transfer by the Förster mechanism is complex in some aspects, but simple and dependable in its resulting effect. Förster distances are accurately predictable from spectral properties of the donor and acceptor, and since no exceptions to the theory have yet been identified, resonance energy transfer can be assumed to occur under any conditions that place the donor-acceptor molecule pair in close proximity. The complexity in the theory describing dipole transfer arises, not because of the transfer mechanism itself, but because of the occurrence of distance distributions (including nonrandom distributions), and diffusion of the donor and acceptor molecules. When steps are taken to average the distance dependence of the energy transfer over a range of geometries and timeframes, FRET is a reliable technique for study of the spatial distributions between interacting molecules.
Application of FRET Techniques in Optical Microscopy
Microscope configurational parameters for fluorescence resonance energy transfer investigations vary with the requirements of the fluorophores, specimen, and imaging mode(s), but virtually any upright or inverted microscope can be retrofitted for FRET microscopy (see Figure 7). In general, the microscope should be equipped with a high-resolution (12-bit) cooled and intensified CCD camera system coupled to quality interference filters having low levels of crosstalk (minimum blocking level) and bandpass regions corresponding closely to the fluorophore spectra. The detector sensitivity determines how narrow the filter bandpass can be and still enable data acquisition to proceed at acceptable speeds with a minimum of spectral bleed-through noise. In most cases, a single dichromatic mirror coupled to excitation and emission filter wheels or sliders should be used to acquire images in order to minimize or eliminate image shifts.
Widefield fluorescence microscopy suffers from fluorophore emission originating above and below the focal plane to yield images with significant out-of-focus signal that reduces contrast and leads to image degradation. This problem is compounded in FRET microscopy because of the inherently low signal levels produced as a result of resonance energy transfer. Digital deconvolution techniques can be coupled to optical sectioning in order to reduce or eliminate signals away from the focal plane, but the process is computationally intensive and may not be fast enough for many dynamic FRET imaging experiments. Laser scanning confocal techniques can be applied to FRET microscopy to produce a significant improvement in lateral resolution, while enabling the collection of serial optical sections at intervals approaching real time. The major drawback of confocal microscopy is the limitation of excitation wavelengths to the standard laser lines available for a particular system, which restricts the choice of fluorophore donor and acceptor pairs in resonance energy transfer experiments. Multiphoton excitation can also be employed in combination with FRET techniques and is less damaging to cells due to the longer excitation wavelengths involved. In addition, autofluorescence artifacts and photobleaching of the specimen are less likely to occur within the restricted excitation volume characteristic of multiphoton excitation.
Based upon the fundamental principles of the phenomenon, a number of important practical points should be considered when fluorescence resonance energy transfer measurements are conducted with an optical microscope:
- The concentrations of donor and acceptor fluorophores must be closely controlled. The statistically highest probability of achieving fluorescence resonance energy transfer occurs when a number of acceptor molecules surround a single donor molecule.
- Photobleaching must be eliminated because the artifact can alter the donor-to-acceptor molecular ratio, and therefore, the measured value of the resonance energy transfer process.
- The donor fluorescence emission spectrum and the acceptor absorption spectrum should have a substantial overlap region.
- There should be minimal direct excitation of the acceptor in the wavelength region utilized to excite the donor. A common source of error in steady state FRET microscopy measurements is the detection of donor emission with acceptor filter sets.
- The emission wavelengths of both the donor and acceptor must coincide with the maximum sensitivity range of the detector.
- The donor absorption and emission spectra should have a minimal overlap in order to reduce the possibility of donor-to-donor self-transfer.
- The donor molecule must be fluorescent and exhibit sufficiently long lifetime in order for resonance energy transfer to occur.
- The donor should exhibit low polarization anisotropy to minimize uncertainties in the value of the orientation (κ-squared) factor. This requirement is satisfied by donors whose emission results from several overlapping excitation transitions.
- When using antibody labeling techniques, reagents conjugated with donor and acceptor fluorochromes should not be altered in their biological activity. Any reduction in activity will seriously affect the validity of resulting resonance energy transfer measurements.
- Because fluorescence resonance energy transfer requires the donor and acceptor molecules to have the appropriate dipole alignment and be positioned within 10 nanometers of each other, the tertiary structure of the reagents to which the molecules are attached must be considered. For example, when donor-acceptor molecules can be attached to different structural locations (such as the carboxy or amino terminus) on a protein, it is possible that FRET will not be observed even though the proteins do interact, because the donor and acceptor molecules are located on opposite ends of the interacting molecules.
- Living cells labeled with green fluorescent protein mutants for FRET investigations should be analyzed using traditional immunohistochemical techniques to verify that the tagged protein adopts the same intracellular habitat and properties as the native counterpart.
In order for the fluorescence resonance energy transfer phenomenon to provide meaningful data as a tool in optical microscopy, both specimen preparation and imaging parameters must be optimized. The selection of appropriate donor and acceptor probes and the manner in which they are employed as molecular labels is a major challenge. In addition, once a labeling strategy that permits energy transfer has been elucidated, a wide spectrum of techniques may be used to perform the measurement itself. A majority of quantitative fluorescence microscopy investigations are conducted by measuring the intensity of fluorescence emission. Fluorescence intensity-based detection of FRET is typically achieved by monitoring changes in the relative amounts of emission intensity at the two wavelengths corresponding to the donor and acceptor chromophores. When conditions are appropriate for fluorescence resonance energy transfer to occur, an increase in acceptor emission (I(A)) is accompanied by a concomitant decrease in donor emission (I(D)) intensity.
Although a change in the relative emission intensity of either donor or acceptor can be taken as indicative of resonance energy transfer, the customary approach is to utilize the ratio of the two values, I(A)/I(D), as a measure of FRET. The value of the ratio depends upon the average distance between donor-acceptor pairs and is insensitive to differences in the path length and volume accessed by the exciting light beam. Any specimen condition that induces a change in the relative distance between the molecular pairs produces a change in the ratio of donor and acceptor emission. Consequently, FRET can be observed in the microscope by preferential excitation of a donor fluorophore and detection of the increased emission of an interacting acceptor fluorophore, accompanied by a reduction in donor fluorescence produced by quenching due to energy transfer. Measurement of FRET employing the intensity-monitoring approach is termed steady state fluorescence resonance energy transfer imaging.
Appropriate donor and acceptor probes are selected on the basis of their absorption and emission spectral characteristics. For maximum resonance energy transfer, the donor emission spectrum should substantially overlap the absorption spectrum of the acceptor. In addition, there should be minimal direct excitation of the acceptor fluorophore at the excitation maximum of the donor, and there should not be significant emission overlap between the donor and acceptor in the wavelength region at which acceptor emission occurs. In practice, it can be difficult to identify donor-acceptor pairs that satisfy these requirements. The situation is often complicated by the fact that the commercially available fluorescence filter sets are not completely effective in passing only the desired wavelengths, and a small percentage of light outside the design passband may be transmitted. Unless very well characterized and controlled expression systems are used, the precise concentration of the donor and acceptor fluorophores may be difficult to determine. Additional corrections may also be required for autofluorescence, photobleaching, and background fluorescence.
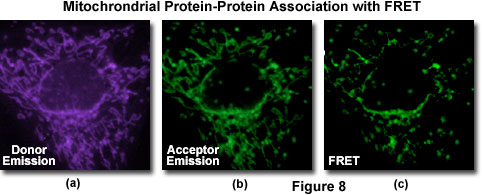
A typical investigation of intracellular protein-protein association in a living cell culture is illustrated in Figure 8 for events associated with apoptosis, a physiological process of cellular death resulting from an intricate cascade of sequential interactions. Gene products directly involved in the chain of events can be labeled by fusion to appropriate members of the fluorescent protein family (in this case, BFP and GFP) for co-expression in the same cell in order to probe specific associations by FRET. The proteins involved with apoptosis interact within the mitochondria and display a gradual decrease in binding as programmed cell death proceeds. Thus, an image of donor emission (Figure 8(a)) contains only fluorescence from the BFP-labeled proteins, while the corresponding acceptor emission profile (Figure 9(b)) illustrates signals due to proteins labeled with GFP (and some contribution from donor emission). A FRET filter (Figure 8(c)), as described below, reveals fluorescence derived from resonance energy transfer between the two proteins
Among the factors that may potentially affect the accuracy of fluorescence resonance energy transfer measurements in general, several are highly specific to the optical microscope. A primary target in microscopy investigations is to obtain high resolution images, and this requires particular attention to the quality and performance of optical filters employed to spectrally discriminate among the absorption and emission wavelengths of the donor and acceptor. In order to maximize the signal-to-noise ratio (without deleteriously affecting the specimen or the process being investigated), it is necessary to carefully balance the intensity and time of exposure to excitation light with the concentration of donor and acceptor fluorophores and the detector efficiency. If the concentration of donor-acceptor fluorophores is excessive, self-quenching can occur, affecting the accuracy of FRET measurements. Photobleaching is a problem with all fluorophores, and can affect the donor-acceptor ratio, altering fluorescence measurements. Excess illumination intensity can also damage specimens, particularly those containing living cells or tissues.
A technique known as donor photobleaching fluorescence resonance energy transfer (pbFRET), which exploits the photobleaching process to measure FRET, is often applied in the study of fixed specimens. Based on pixel-by-pixel analysis, the method has been applied to measure proximity relationships between cell surface proteins labeled with fluorophore-conjugated monoclonal antibodies. Photobleaching FRET is founded on the theory that a fluorophore is sensitive to photodamage only when it is elevated to an excited state. Statistically, only a small proportion of molecules are in an excited state at any one time, and therefore, fluorophores with longer fluorescence lifetimes have a higher probability of suffering photodamage and exhibit a higher rate of photobleaching.
Experimental evidence supporting this concept has demonstrated that the photobleaching time of a fluorophore varies inversely with its excited-state lifetime. The occurrence of resonance energy transfer reduces the fluorescence lifetime of the donor molecule, effectively protecting it against photobleaching. Calculations of pbFRET are based on the decreased rate of donor photobleaching relative to that measured for the donor in the absence of resonance energy transfer. The measurement of photobleaching in FRET studies requires a relatively long timeframe, and therefore is most applicable to fixed cell specimens in which temporal data is not important and the effect on cell function from photobleaching is not an issue. In some respects, the donor photobleaching technique is less complicated than sensitized emission measurement, although fitting of time constants to photobleaching curves involving multiple components presents some additional difficulties.
The energy transfer efficiency can also be determined by acceptor photobleaching techniques, in which the change in donor emission quenching is measured by comparing the value before and after selectively photobleaching the acceptor molecule. Analysis of the change in donor fluorescence intensity in the same specimen regions, before and after removal of the acceptor, has the advantage of requiring only a single specimen preparation, and directly relates the energy transfer efficiency to both donor and acceptor fluorescence.
Accurate measurement of fluorescence resonance energy transfer in the microscope requires compensation for all of the potential error sources. A straightforward technique to correct for detection of donor fluorescence with the acceptor emission filter and acceptor fluorescence with the donor emission filter (due to crossover or spectral bleed-through) has been developed. The method also corrects for the dependence of FRET on the concentrations of the donor and acceptor fluorophores. The measurement strategy, which requires a minimum of spectral information, utilizes a combination of three filter sets and can be readily implemented. The donor, FRET, and acceptor filter sets are designed to isolate and maximize three specific signals: donor fluorescence, acceptor fluorescence attributable to FRET, and the directly excited acceptor fluorescence, respectively. In practice, three different specimens, containing just donor, just acceptor, and both donor and acceptor are examined with each of the three filter sets, and the resulting data manipulated arithmetically to correct for crossover and for uncontrolled variations in donor-acceptor concentrations.
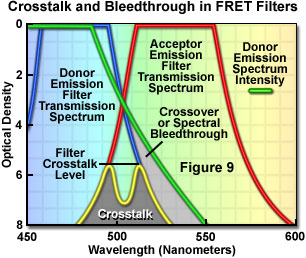
Presented in Figure 9 are schematic illustrations of crossover (spectral bleed-through) and filter crosstalk, two significant problems that must be overcome in order to achieve quantitative results in fluorescence resonance energy transfer experiments. Crossover or bleed-through is manifested by an overlap of the donor fluorescence emission spectrum with the bandpass region of the acceptor emission interference filter in Figure 9, resulting in donor emission signal (unwanted wavelengths) being transmitted through the emission filter. In contrast, filter crosstalk describes the minimum attenuation (blocking) level over a specific range of two filters placed together in series, and is of concern when matching excitation and emission filters for fluorescence sets. Dichromatic mirrors are often included in crosstalk evaluation of fluorescence filter combinations. Although two emission filters are rarely placed in the light path at the same time, the spectra are drawn together in Figure 9 to simultaneously illustrate both concepts. Note that the two filter spectra (blue and red curves) represent light transmittance by the interference filters, whereas the donor emission curve (green) is a plot of intensity versus wavelength.
Additional factors, which can potentially introduce significant errors, also require correction when steady state FRET measurement techniques are employed. Furthermore, careful control of the donor and acceptor fluorophore concentrations is desirable. Fluorophore concentration determinations can be partially avoided through the application of time-resolved fluorescence measurements, which provide a method of obtaining average lifetimes without a precise knowledge of donor concentrations. The technique enables quantitative determination of donor-acceptor separation distances, and is based on measurements of the donor lifetime in the presence and absence of the acceptor. Measuring fluorescence intensity decay as a function of time elucidates the emission dynamics of the excited-state molecule, and consequently, more detailed information about the nature of the donor-acceptor interaction may be obtained. Graphical plots of intensity decay illustrate time-averaged details of the fluorescence decay process (see Figure 10(a)), which are unresolved when employing steady state techniques. Measurements indicating the same value for average lifetime, when recorded as steady state intensity normalized to absorption, may correspond to significantly different decay curve shapes in time-resolved data plots, indicating differences in the intermolecular processes involved.
The fluorescence lifetime (τ) of a fluorophore is the characteristic time that a molecule exists in the excited state prior to returning to the ground state. Representing fluorescence decay in a simplified single exponential form following a brief pulse of excitation light, the fluorescence intensity as a function of time (t) is given by the equation:
I(t) = I0 exp (-t/τ)
where I(0) is the initial fluorescence emission intensity immediately after the excitation light pulse, and I(t) is the fluorescence intensity measured at time t. The fluorescence lifetime (τ) is defined as the time required for the intensity to decay to 1/e of its initial value (approximately 37 percent of I(0); Figure 10(a)), and is the reciprocal of the rate constant for fluorescence decay from the excited state to the ground state.
The primary overall advantage of time-resolved versus steady state FRET measurements is that donor-acceptor separation distances can be mapped with greater quantitative accuracy. This results in part because fluorescent lifetimes do not depend upon local intensity or concentration, and are largely unaffected by photobleaching of the fluorophores. Fluorescence lifetimes are, however, highly sensitive to fluorophore environment, and even molecules with similar spectra may display distinct lifetimes under different environmental conditions. Because scattering does not affect fluorophore lifetimes, measurements of lifetime variation can provide information that is specifically related to local molecular processes.
The lifetime of a fluorophore is subject to modification by numerous variables in the local microenvironment, including factors such as hydrophobicity, oxygen concentration, ionic strength of other media components, binding to macromolecules, and the proximity to acceptor molecules that can deplete the excited state by resonance energy transfer. It is a significant practical advantage that lifetime measurements can serve as absolute indicators of molecular interactions, and are independent of fluorophore concentration.
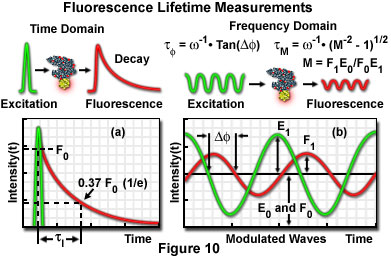
Two general techniques commonly employed to measure fluorescent lifetimes are categorized as the time-domain (pulsed, see Figure 10(a)) and frequency-domain (also termed phase-resolved; Figure 10(b)) methods. Time-domain lifetime measurements employ pulsed excitation light sources, and the fluorescent lifetime is obtained by directly measuring the emission signal or by photon-counting detection. The frequency-domain approach utilizes sinusoidal modulation of the excitation light source (obtained from pulsed or modulated laser systems), and lifetimes are determined from the phase shift and demodulation depth of the fluorescence emission signal. Each of these approaches to fluorescence lifetime imaging has specific advantages and disadvantages, and both have been widely applied to conventional widefield, confocal, and multiphoton microscopy.
Illustrated in Figure 10 are schematic diagrams representing the time domain and frequency domain techniques for determination of fluorescence lifetimes. In the time domain approach (Figure 10(a)), the specimen is excited by a brief pulse of laser light having a duration much shorter than the lifetime of the excited species, and the exponential decay profile is measured as a function of time. Fluorescence decay is usually a monoexponential function for a single fluorophore, but can display far more complex character if the excited state has numerous relaxation pathways available in the environment. Sinusoidally modulated light from a continuous wave laser coupled to an acousto-optical modulator is employed to excite the fluorophore in frequency domain experiments (Figure 10(b)). The resulting fluorescence emission is sinusoidally modulated at the same frequency as the excitation, but is accompanied by a phase shift and reduction in the modulation depth. In the case of a single exponential decay, the fluorescence lifetime can be calculated by determining either the degree of phase shift (φ), or the modulation ratio (M), using the equations presented in Figure 10(b). If the two values are identical, fluorescence decay is truly composed of a single exponential function. When more than one fluorescent species is present (or a single fluorophore experiences a complex environment), the phase shift and modulation lifetimes should be evaluated over a wide range of frequencies.
The time-domain technique for measuring fluorescence lifetime relies essentially on single-photon counting and requires a detection system with sufficient temporal resolution to collect nearly 100 percent of the photons generated by each excitation pulse. Although phase-resolved techniques are relatively less demanding to perform, they are not generally as sensitive as the photon-counting approach. When phase modulation is employed to resolve complicated multifluorophore lifetimes, long exposure times to damaging excitation illumination can prove to be excessive for some specimens, and also may not provide sufficient temporal resolution for live-cell processes. The preferred technique depends upon both the information required from the investigation and the type of specimen being studied.
Fluorescence lifetime measurements have proven to be a sensitive indicator of FRET, and have particular advantages in live-cell studies because of the independence of lifetime measurements upon factors such as concentration and light path length, which are difficult to control in living specimens. A primary advantage of performing FRET studies by fluorescence lifetime measurement lies in the fact that it is possible to distinguish energy transfer even between donor-acceptor pairs with similar emission spectra. When fluorescence lifetimes are measured directly (in contrast to the use of steady state values), a determination of FRET is possible without the photodestruction of the donor or acceptor fluorophores. Because FRET reduces the fluorescence lifetime of the donor molecule through energy transfer to the acceptor, a direct comparison of the donor lifetime in the presence of the acceptor (τ(DA)) to that in the absence of the acceptor (τ(D)), enables the calculation of a FRET efficiency value (E(T)) for each image pixel.
Depending upon the technique, fluorescence lifetime measurements require the specimen to be exposed to either high-frequency repetitive pulses of excitation light, or to continuous sinusoidally modulated light. In studies with living cells, the effect of high-intensity illumination must always be evaluated. Regardless of the method, the reference lifetime of the donor without acceptor must be determined under experimental conditions identical to those of the donor-acceptor measurement. One means of accomplishing this with a single specimen is to measure the donor-only lifetime after photobleaching destruction of the acceptor following the energy transfer experiment.
Conclusions
In biological investigations, the most common applications of fluorescence resonance energy transfer are the measurement of distances between two sites on a macromolecule (usually a protein or nucleic acid) or the examination of in vivo interaction between biomolecular entities. Proteins can be labeled with synthetic fluorochromes or immunofluorescent fluorophores to serve as the donor and acceptor, but advances in fluorescent protein genetics now enable researchers to label specific target proteins with a variety of biological fluorophores having differing spectral characteristics. In many cases, the amino acid tryptophan is used as an intrinsic donor fluorophore, which can be coupled to any number of extrinsic probes serving as an acceptor.
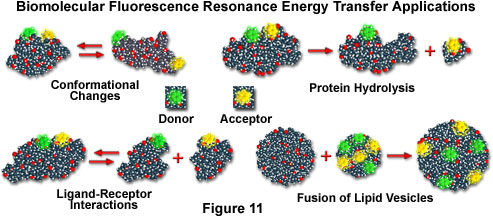
If macromolecules are labeled with a single donor and acceptor, and the distance between the two fluorochromes is not altered during the donor excited state lifetime, then the distance between the probes can be determined from the efficiency of energy transfer through steady state measurements, as discussed above. In cases where the distance between the donor and acceptor fluctuates around a distribution curve, such as protein assemblies, membranes, single-stranded nucleic acids, or unfolded proteins (see the scenarios presented in Figure 11), FRET can still be employed to study the phenomena, but time-resolved lifetime measurements are preferred. Several biological applications that fall into both cases are illustrated in Figure 11, including conformational changes, dissociation or hydrolysis, fusion of membrane-like lipid vesicles, and ligand-receptor interactions.
Although various methods are available for the measurement of fluorescence resonance energy transfer in the optical microscope, none are completely without disadvantages. Some techniques require more elaborate and expensive instrumentation, while others are based on assumptions that must be carefully validated. Certain approaches are appropriate for fixed specimens, but cannot be applied to living cell systems, while other methods must incorporate significant corrective calculations or data analysis algorithms. It is certain, however, that FRET analysis shows great promise for further development in the utility and scope of biological applications. Dramatic improvements in instrumentation have occurred in recent years, particularly with respect to time-resolved techniques.
Fluorescence lifetime measurements that were only accomplished with extreme difficultly in the past are now aided by mature picosecond and nanosecond technologies. Advances in fluorescent probe development have produced smaller and more stable molecules with new mechanisms of attachment to biological targets. Fluorophores have also been developed with a wide range of intrinsic excited state lifetimes, and a significant effort is being placed on development of a greater diversity in genetic variations of fluorescent proteins. Entirely new classes of fluorescent materials, many of which are smaller than previous fluorophores and allow evaluation of molecular interactions at lower separation distances, promise to improve the versatility of labeling and lead to new applications of the FRET technique.
Sorry, this page is not
available in your country.