Flow cytometry is one of the main techniques used to identify and segment cellular populations due to its ability to quickly evaluate large populations of cells using fluorescent markers. However, flow cytometry comes with limitations that must be addressed with other techniques. With the advancement of image analysis tools, image cytometry has emerged as a better way to access even more information while evaluating large cell populations.
This post will explore flow cytometry in detail and share how the expanding field of image cytometry is providing researchers with powerful tools to improve their work.
What Is Flow Cytometry?
For decades, one of the main tools for identifying and analyzing molecular markers on cell populations has been flow cytometry. In this technique, cells are dissociated into a single-cell suspension and marked with fluorescently tagged antibodies targeting the markers of interest. These cells are then passed through a flow cytometer where they can be individually analyzed for expression of each marker, leading to valuable quantifiable data on cell population.
This essential tool lets researchers quantify the presence and intensity of proteins on their cells of interest, enabling the segmentation and identification of cell populations, as well as sorting of cells.
Drawbacks of Flow Cytometry
While flow cytometry can provide large volumes of quantifiable data at the cellular level, this technique has drawbacks caused by the fact that measurement must be taken from single cells in suspension.
Drawbacks of flow cytometry include:
- Many cells are cultured while adhered to tissue culture plates and scaffolds, or in tissues or structures with other cells. Once cells are dissociated from their environment, their protein expression may change. Also, data on protein interactions between cells may be lost.
- Data on cell morphology, as well as the location of molecular markers on the cell, can’t be accessed.
- The stress caused to cells during flow cytometry can impact their ability to continue to grow post analysis. Often large numbers of cells don’t survive the process.
- The measurement tools used in a flow cytometer limit visualizations to quantitative data in charts. Visual evaluation of the cells is impossible.
Due to these drawbacks, flow cytometry analysis is often supplemented with immunohistochemical staining of cells in their environment. However, most image analysis tools can’t provide the same level of quantitative data, and structural features on individual cells can’t be correlated one-to-one to their analysis via flow cytometry.
The expanding field of image cytometry addresses these concerns by using imaging analysis tools that can provide quantitative data on populations equivalent to that in flow cytometry. Our scanR high-content screening station and software are examples of tools that can meet these needs.
Benefits of Image Cytometry
In image cytometry, cells are imaged directly in their culture environment, and then the images are processed and translated into quantitative analyses on the parameters of interest.
Benefits of image cytometry include:
- Reduced risk of changes to protein expression caused by dissociation.
- Data on cell morphology and protein localization are maintained and can be integrated into quantitative analyses. For example, you can determine the population of cells expressing high levels of a marker within the nucleus.
- No physical stress is put on the cells during analysis. Even more, image cytometry can take advantage of artificial intelligence (AI) technology to identify cells and cellular features with minimal or no staining. This helps ensure cells can continue to be cultured after the analysis.
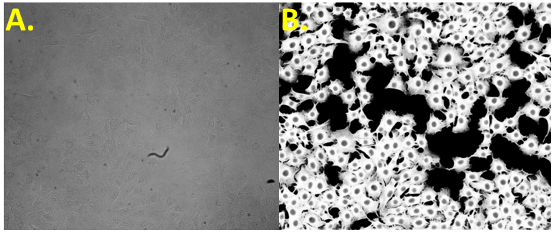
(A) Brightfield image of label-free cells. (B) AI prediction of actin location
- The same cells can be monitored and tracked over time. This can be valuable for drug discovery, cell differentiation, and more. For example, if a researcher wanted to see the effect of a drug on patient primary cells over time using flow cytometry, they would need to grow and treat additional replicates for each timepoint because dissociation is required. Since cells can remain in a culture environment during image cytometry, the same replicate can be measured at multiple timepoints.
For researchers familiar with flow cytometry, analyzing data with image cytometry in scanR software is an easy transition since it uses similar histograms and scatterplots to display data. Just like in flow cytometry, populations can be selected via gates in the graphs to perform multilevel analyses. Unlike flow cytometry, each evaluated parameter can be correlated back to the image to be visually confirmed because the data is collected directly from images.
Consider the following example. In scanR software, you can click on any data point to view the cell in question or create a gallery of images from a gated population. This adds a layer of visual assurance that cell populations are segmented correctly and that you are identifying the correct populations of interest.
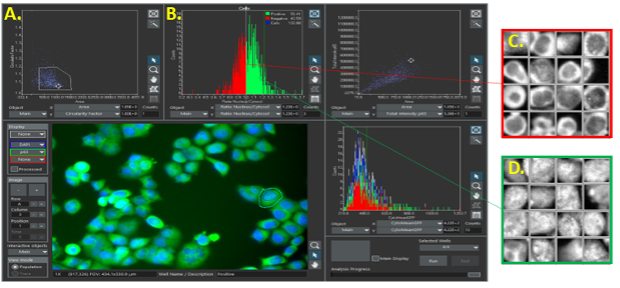
Image cytometry in scanR software. A) Points identified as cells are gated and then displayed as a histogram (B). Cells are then separated into two populations, which can be viewed in image galleries (C, D).
In short, image cytometry with scanR software takes some of the best analytical tools from flow cytometry and combines them with the benefits of image-based analysis. See the table below for a summary of these advantages:
Comparing the Benefits of Flow Cytometry vs. Image Cytometry
| Flow Cytometry | Image Cytometry | |
|---|---|---|
| Cell state | In suspension | In culture environment |
| Dataset size | Unlimited | Unlimited |
| Concurrent acquisition and analysis | ✓ | ✓ |
| Fluorescent intensity | ✓ | ✓ |
| Fluorescence localization and distribution | ✓ | |
| Cell morphology | ✓ | |
| Multilevel analysis | Limited | ✓ |
| Cell sorting | ✓ | |
| Label-free capability | Limited | ✓ |
The versatile toolset of image cytometry enables researchers to quantify and evaluate large cellular populations based on any feature visible in an image—from morphology, location, fluorescence intensity and localization, and more—without requiring stressful manipulation of the cells. Researchers can gather both broader and deeper results from their experiments, leading to better quality and more efficient research.
Related Content
Video: An Introduction to the scanR High-Content Screening Station
Advanced Live-Cell Analysis Using AI-Driven High-Content Screening Systems