3D Analysis of Patient-Derived Tumor Organoids
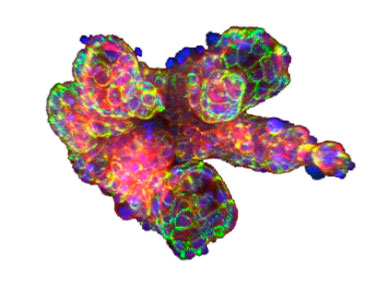
Confocal images of patient-derived tumor organoids (PDOs) were quantitatively analyzed using NoviSight™ 3D software to evaluate their morphological features and antibody binding of molecular targeted drugs.
Introduction
3D tissue models are popular for drug discovery since they mimic the in vivo microenvironment. PDOs are one of the most powerful tools to recapitulate the original patients’ drug response. In fact, a recent study reveals that phenotypic and genotypic profiling of PDOs feature a high degree of similarity to the original patient tumor. More importantly, the PDOs could predict drug reactivity with more than 80% accuracy.
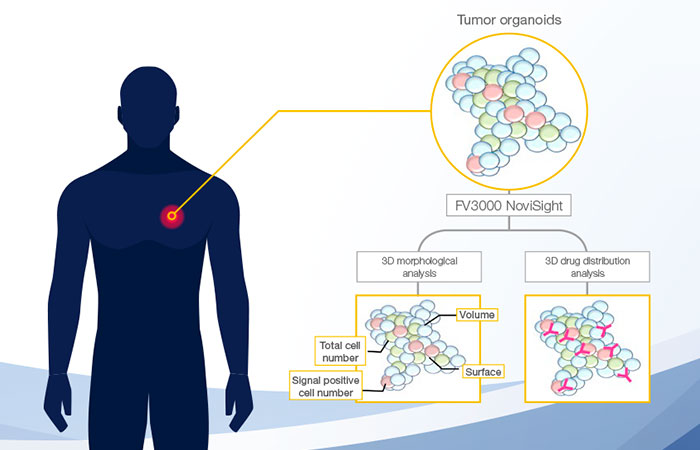
By using Fukushima patient-derived tumor organoids (F-PDO®), Olympus’ FLUOVIEW® FV3000 confocal laser scanning microscope, and NoviSight 3D analysis software, we offer a novel workflow for PDO morphology and drug distribution.
Graphical Abstract
Benefits
- Image and analyze PDOs while retaining the information in their 3D structure.
- NoviSight software can identify objects in 3D, classify the objects, and deliver statistical data.
Methods
Cell preparation
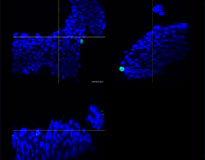
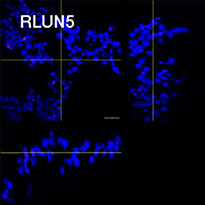
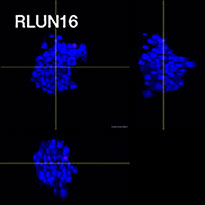
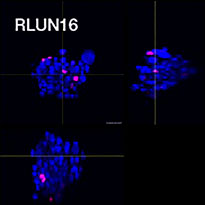
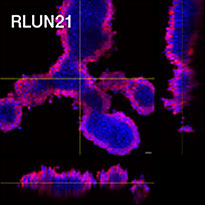
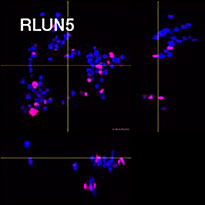
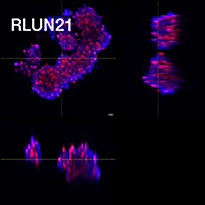
To prepare the cells, we used three types of lung F-PDOs (RLUN5, RLUN16, and RLUN21). RLUN5 was grown from an adenosquamous carcinoma tumor while RLUN16 and RLUN21 were grown from a squamous carcinoma tumor. RLUN21 forms large cell aggregates and features a larger cytoplasm than the others (Fig. 1).
The F-PDOs were then centrifuged, collected, and fixed with 4% paraformaldehyde overnight. Erbitux®, an epidermal growth factor receptor (EGFR) inhibitor, and Herceptin®, a human epidermal growth factor receptor 2 (HER2) inhibitor, were labeled with HiLyte™ Fluor 555 (Chemical Dojin) and incubated with F-PDOs for three hours.
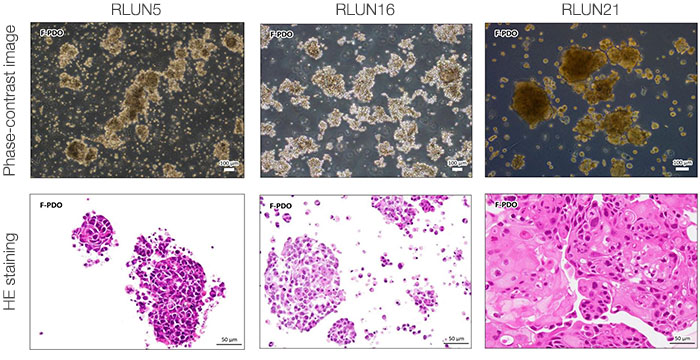
Figure 1 F-PDOs
Immunostaining and clearing
We performed the Hama et al. immunostaining protocol with some modification (Fig. 2). Each fixed F-PDO was incubated overnight with a Ki67 antibody (Abcam, 16667) and diluted with AbScale solution (0.33 M Urea and 0.2% Triton-X100). After washing with AbScale, the F-PDOs were incubated with a second antibody for three hours and diluted with AbScale. After washing with AbScale rinse solution for an hour, F-PDOs were re-fixed with 4% paraformaldehyde. Then they were washed with a phosphate-buffered saline (PBS) solution and incubated overnight using the clearing reagent ScaleS4 with DAPI. The cleared F-PDOs were then imaged with Olympus’ FV3000 confocal laser scanning microscope.
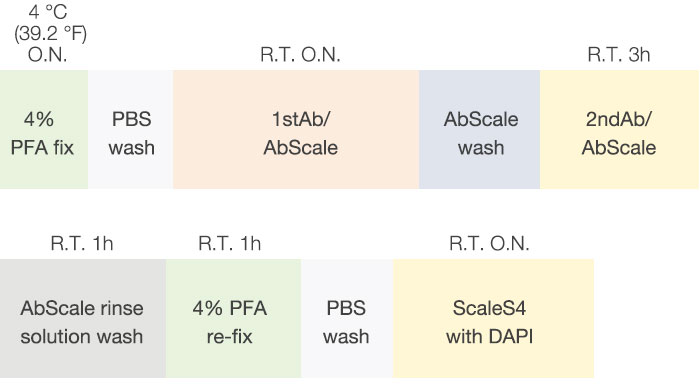
Figure 2 F-PDOs immunostaining and clearing scheme
Imaging and analysis
We used 10× or 30× magnification with 2 μm Z pitch to capture images of the cleared F-PDOs for 3D analysis.
An appropriate Z pitch setting is important for accurate 3D cell analysis. The images were then imported into NoviSight™ software and reconstructed in 3D. NoviSight software can recognize 3D objects, such as a nucleus, and convert them into quantitative data.
Results
3D quantification of F-PDO morphology
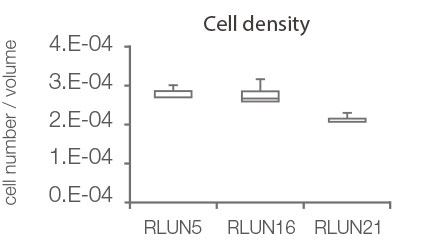
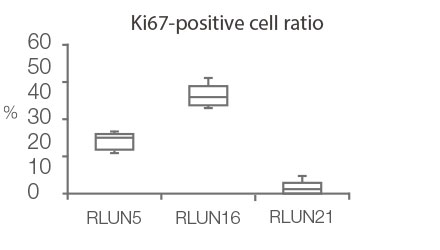
NoviSight software enabled us to quantify PDOs using several Z-plane images. By staining their nuclei, the analysis software captured the whole structure and enabled single cell recognition (Fig. 3A). It also added each recognized object on the graph as a single plot. When the software recognized each nucleus as an object, we extracted Ki67 positive cells both graphically and three dimensionally by gating high Ki67 intensity plots (Fig. 3B). Using these methods, we quantified the F-PDO’s cell number, volume, cell density, and Ki67 positive cell ratio (Fig. 3C). We found RLUN21’s Ki67 positive ratio was lower than the others. Also, the larger cytoplasm RLUN21 may have caused its low cell density.
A | |||
 Original RLUN21 | 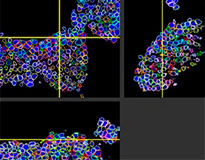 Nuclear recognition | 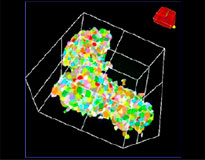 Nuclear recognition volume view | 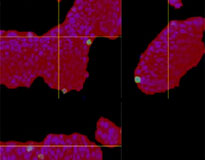 RLUN21 |
B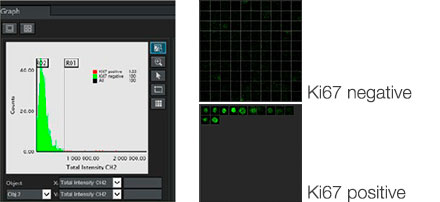 | C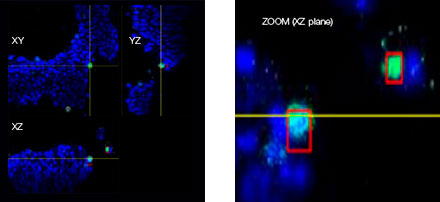 |
D
| RLUN5 | RLUN16 | RLUN21 | |
| cell number | 926 (±719) | 294 (±162) | 2595 (±1480) |
| volume (voxels) | 3.35.E+06 (±3.26.E+06) | 1.08.E+06 (±6.85.E+05) | 1.13.E+07 (±9.12.E+06) |
 |  |
| Figure 3 3D quantification of F-PDOs morphology |
A. Original 3 side views of RLUN21, NoviSight 3D nuclear recognition (3 sides and volume view) and NoviSight structure recognition.
B. Ki67 positive/negative cells were sorted by Ki67 intensity. NoviSight software can display sorted cells in a “Gallery view.”
C. Classified Ki67 positive cells can be displayed in 3D with a red circle.
D. Quantitative data of F-PDOs.
3D Drug distribution analysis
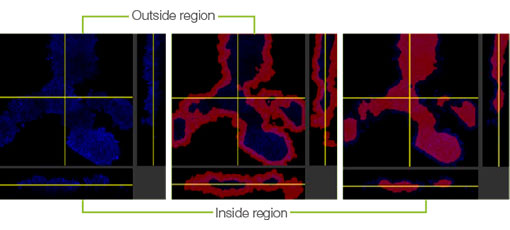
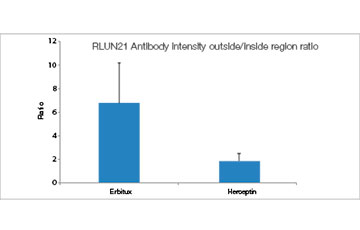
When we added the HyLight-555-labeled Erbitux or Herceptin to each F-PDO, Erbitux uniformly bound RLUN21 from its surface while Herceptin irregularly bound RLUN21. NoviSight™ software’s volume recognition module quantified the antibody drug positive volume ratio (Fig. 4A). We then used NoviSight software to quantify the difference in binding styles since it can modify the analysis-targeted region. To do so, we created two targeted regions: a reduced volume region from the surface at a certain percentage and an outline volume region with any width. We calculated antibody drug intensity during the volumes. We noticed a large quantitative difference between the reduced volume and outline volume in Erbitux while there was a few in Herceptin. This means Erbitux strongly bound to the RLUN21 outline region while Herceptin bound to RLUN21 without bias. This method enabled us to quantitatively show antibody drug distribution.
A
 |  |
| Antibody drug 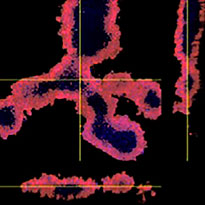 |
|
 |
| Antibody drug 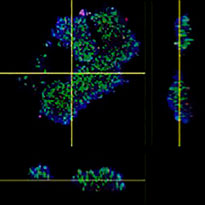 |
Antidoby positive volume (%)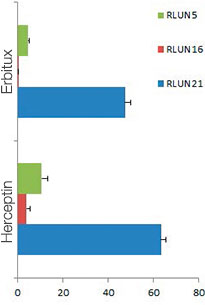
B
 |  |
| Figure 4 3D quantification of antibody drug distribution |
A. 3 side images of F-PDOs with Erbitux or Herceptin, and NoviSight volume recognition of antibody drug bindings. The graph shows antibody binding volume in whole volume.
B. NoviSight region modification module. NoviSight can modify the analysis-targeted region to provide quantitative data in the limited region.
Conclusion
In this study, we revealed that NoviSight software can perform quantitative analysis of PDOs morphologically and pharmacologically using images captured by Olympus’ FV3000 confocal laser scanning microscope. By combining the high-resolution images of the FV3000 microscope with the high recognition accuracy of NoviSight software, we can produce more reliable quantitative results.
Reference
- Vlachogiannis G et al., (2018) Patient-derived organoids model treatment response of metastatic gastrointestinal cancers. Science. 359(6378):920-926. doi: 10.1126/science.aao2774
- Takahashi et al., (2019) An In Vitro System for Evaluating Molecular Targeted Drugs Using Lung Patient-Derived Tumor Organoids. Cells. 8(5), 481. doi:/10.3390
- Tamura H, et al. Evaluation of anticancer agents using patient-derived tumor organoids characteristically similar to source tissues. Oncol Rep.,40, 635-646, 2018
- Hama et al., (2016) Deep Imaging of Cleared Brain by Confocal Laser-Scanning Microscopy. Nature Protocol Exchange. doi:/10.1038 Mayu
Authors
Mayu Ogawa (Olympus)
Acknowledgment
This study was supported by Professor Takagi of Fukushima Medical University. To learn more about F-PDO (Fukushima patient-derived organoids), please visit https://www.fmu.ac.jp/home/trc/en/contract-research-provision/f-pdo/
Products related to this application
Sorry, this page is not
available in your country.