Predicting Multi-Class Nuclei Phenotypes for Drug Testing Using Deep Learning
Introduction
Quantifying the dynamic movement of proteins, such as nuclear receptors in response to drugs, requires robust nuclear segmentation methods using dyes and stains. However, this process has notable limitations: live cell staining procedures are time-consuming, expensive, and can lead to phototoxicity, photobleaching, and inactivation of photosensitive compounds (e.g., R18811).
To overcome these challenges, we developed a neural network (NN) using cellSens™ imaging software with TruAI™ deep-learning technology to identify cell nuclei without using fluorescent labels. We then trained the NN to distinguish between different cell phenotypes in response to drugs. Here, we apply the NN workflow to predict intracellular androgen receptor (AR) dynamics in live prostate cancer cells treated with AR-targeting drugs.
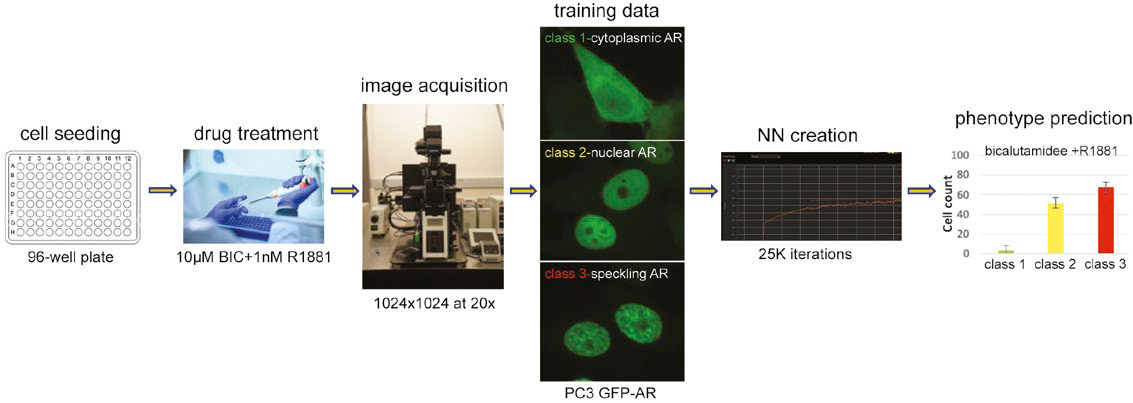
Figure 1: Workflow to predict multi-class nuclei phenotypes using a trained NN.
Upon activation, cytoplasmic AR translocates to the nucleus where it localizes to transcriptionally active sites, which can be visualized as a distinct speckling pattern using confocal microscopy. To predict the AR dynamics, we first generated a NN that detects cell nuclei without using nuclear stains. Then we classified cells based on GFP-AR nuclear translocation and transactivation (speckling) status―both essential assay readouts to test compounds for their ability to target AR. Finally, we demonstrated that our NN workflow successfully predicts these critical AR phenotypes without nuclear staining.
Benefits
- Identify nuclei phenotypes without using fluorescent labels
- Save time and costs spent on nuclear dyes (staining and imaging)
- Reduced phototoxicity and photobleaching
- Preserves activity of photosensitive compounds
Methods
We generated a training data set consisting of three major AR phenotypes commonly observed in response to drugs. We used half of the images to generate the NN, and the other half to evaluate its performance. Finally, we applied our multi-class NN to an independent data set without a nuclear stain.
Training data preparation from three AR phenotypes
As a first step in building a NN, we generated a training data set consisting of three major AR phenotypes:
- Inactive, cytoplasmic AR (no treatment control, NTC)
- Ligand-bound but inactive nuclear AR (10 μM bicalutamide)
- Active nuclear AR speckling (1 nM R1881)
To generate ground truth data, we stained nuclei using SiR-DNA. We acquired 1024 1024 pixel ratio images with a UPLSAPO 20X objective using the Olympus FV3000 laser confocal microscope’s galvanometer scanner. Here we divided the entire data set (60 images) into two equal parts for the training set and validation set (30 images each). To train the NN, we used 10 maximum intensity projected GFP-AR images from each of the three AR phenotypes (50% of the data, 30 images total) with a nuclear stain.
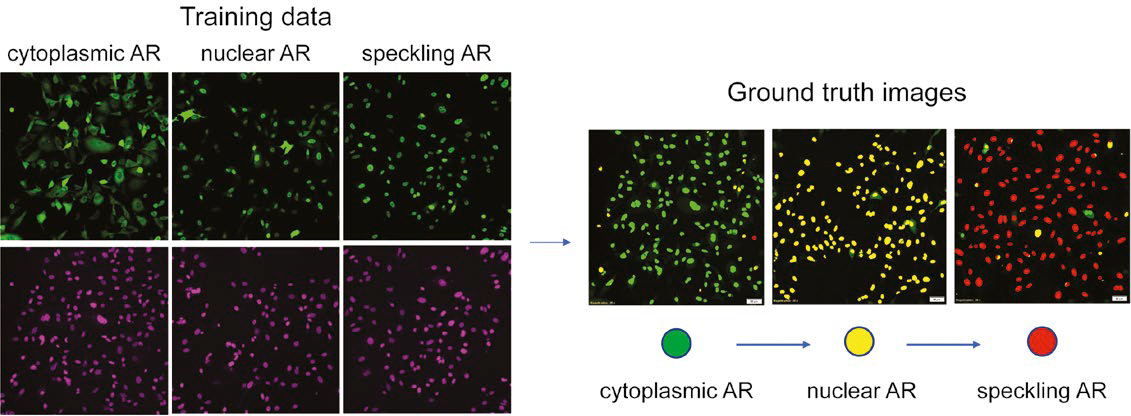
Figure 2: Preparation of multi-class AR phenotype training data based on nuclei staining. (Left) green: AR-GFP, purple: SiR-DNA. (Right) evaluation of ground truth data sets.
Ground truth optimization
Figure 2 demonstrates the ground truth data evaluated by the NN, with cytoplasmic AR in green, nuclear AR in yellow, and speckled AR in red. Using this color-coded segmentation map, we fine-tuned the ground truth by manually correcting errors in nuclear detection and segmentation and reclassifying miscategorized nuclei.
Neutral network creation using TruAI™ deep-learning technology
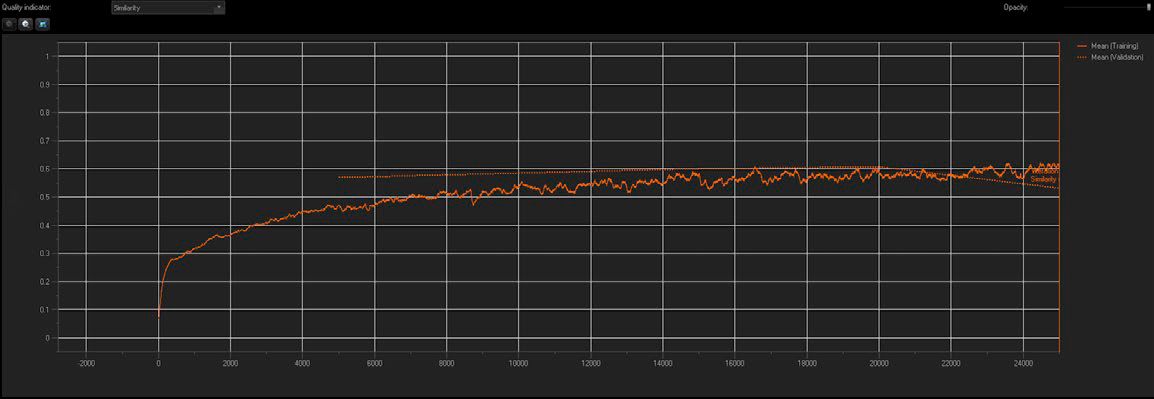
Figure 3: NN training reports the similarity index and validation mean values in real time.
We used TruAI technology to create a standard NN with multi-class configurations, incorporating 10 training images from each AR phenotype. Quality and accuracy of the NN were reported in real time. As shown in Figure 3, the similarity index increased with each successive iteration during the training process until a plateau was reached, indicating a training saturation (downward arrow). Checkpoints were created every 5,000 iterations (20% progress), and the optimal checkpoint was saved as a trained NN along with its similarity index value.
Results
Validation of a multi-class neural network on blind data
We validated our multi-class NN model using the 50% of the images not used for ground truth or NN training (blind data). We then used these validation results to fine-tune the model parameters by applying an area filter (min. 49.83 μm – max. 555.44 μm ) to eliminate cell debris and mis-segmented cells. The trained NN model predicted multi-class AR phenotypes independently without any nuclear stain. Figure 4 shows the phenotype class distribution using data from 10 images.
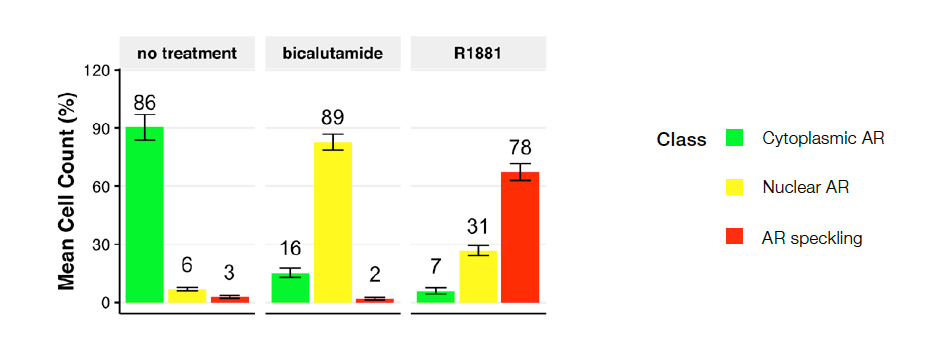
Figure 4: Cell class distribution for the following conditions: no treatment control (left), bicalutamide (middle), or R1881 (right). Plot depicts the percentage of cells categorized as class 1 (cytoplasmic AR), class 2 (nuclear AR), and class 3 (speckled AR). No treatment control resulted in mostly class 1 cells. Bicalutamide (AR antagonist) induced a shift toward class 2, and R1881 (AR agonist) led to class 3, active AR localized at transcriptionally active sites.
Prediction of multi-class AR phenotypes on independent data sets
Next, to evaluate the multi-class NN model on independent images, we prepared a new data set using two clinical antiandrogens: bicalutamide and enzalutamide (Figure 5).
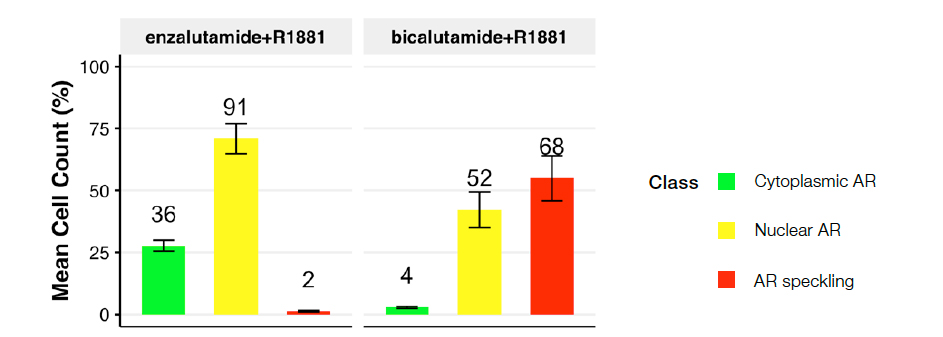
Figure 5: Cell class distribution for the following conditions: R1881 plus enzalutamide (left) or bicalutamide (right). Plot depicts predicted nuclei class distribution across treatment conditions.
Treatment with the second-generation antiandrogen enzalutamide led to a prominent cytoplasmic AR (class 2) population with little or no speckling AR (class 3), suggesting an effective blockade of ligand-induced AR activation. In contrast, the older, less effective antiandrogen bicalutamide led to a notable shift toward active AR (class 3), suggesting its inability to effectively block 1nM R1881-induced AR activation. These data confirm previous studies2.
Conclusion
Using the Olympus FV3000 confocal microscope and cellSens™ software with the TruAI™ deep-learning module, we generated a NN to detect and segment unstained nuclei, and subclassify cells based on AR phenotypic changes in response to drugs. This approach has the potential to increase drug testing efficiency by cutting down on testing time (experimental setup) and costs.
Further, NNs can increase data quality by reducing artifacts such as phototoxicity, photobleaching, and inactivation of photosensitive compounds, and detect subtle changes that may be overlooked by the researcher and/or traditional image analysis pipelines. This deep-learning approach can be applied more broadly to subclassify cell populations based on nuclear or cell-based parameters ranging from protein localization to morphometric changes.
References
- Risek B, Bilski P, Rice AB, Schrader WT. Androgen receptor-mediated apoptosis is regulated by photoactivatable androgen receptor ligands. Mol Endocrinol. 2008 Sep;22(9):2099-115. doi: 10.1210/me.2007-0426. Epub 2008 Jun 18. PMID: 18562628; PMCID: PMC2631375.
- Sugawara T, Lejeune P, K hr S, Neuhaus R, Faus H, Gelato KA, Busemann M, Cleve A, Lücking U, von Nussbaum F, Brands M, Mumberg D, Jung K, Stephan C, Haendler B. BAY 1024767 blocks androgen receptor mutants found in castration-resistant prostate cancer patients. Oncotarget. 2016 Feb 2;7(5):6015-28. doi: 10.18632/oncotarget.6864. PMID: 26760770; PMCID: PMC4868737.
Authors
- Harish Sura, Katherin Patsch, and Seungil Kim of the Lawrence J. Ellison Institute for Transformative Medicine, University of Southern California, Los Angeles, CA
- Shohei Imamura, Strategic Project Manager, Olympus Corporation of the Americas
Products Related to This Application
Sorry, this page is not
available in your country.