MTF charts provide a quantitative and standardized way to compare the performance of different lenses. As a result, they are a powerful measurement tool for optical instrument design.
For those who are unfamiliar, MTF stands for modulation transfer function. This parameter measures a lens’ ability to transfer the contrast of a sample to an image using spatial frequency (resolution). Spatial frequency indicates the number of line pairs (i.e., one black and one white line) per millimeter (lp/mm). See Figure 1 for examples.
High-quality optics transfer more contrast at higher frequencies (i.e., at a higher resolution). Even if the frequency (resolution) is high, a low contrast will inhibit your ability to clearly see sample details. This means contrast is just as important as resolution for image quality. In an MTF chart, the lens’ contrast is plotted against the frequency. The curves on the chart enable you to visually compare the performance differences between lenses.

Figure 1. Examples of different spatial frequencies (resolution).
Engineers will request MTF charts from lens manufacturers during the design process. For instance, we have recently received many requests for optical MTF charts from engineers designing cell analyzers, DNA sequencers, slide scanners, or industrial inspection equipment. To help our customers design the best optical system, this post will explain different ways to use MTF charts.
Example of an MTF Chart (and How to Read It)
Figure 2 below shows an example of an MTF chart. The field of view is fixed, the horizontal axis shows the spatial frequency, and the vertical axis shows the contrast. The chart shows that 50% contrast can be achieved with this lens at a spatial frequency of 30 lp/mm.
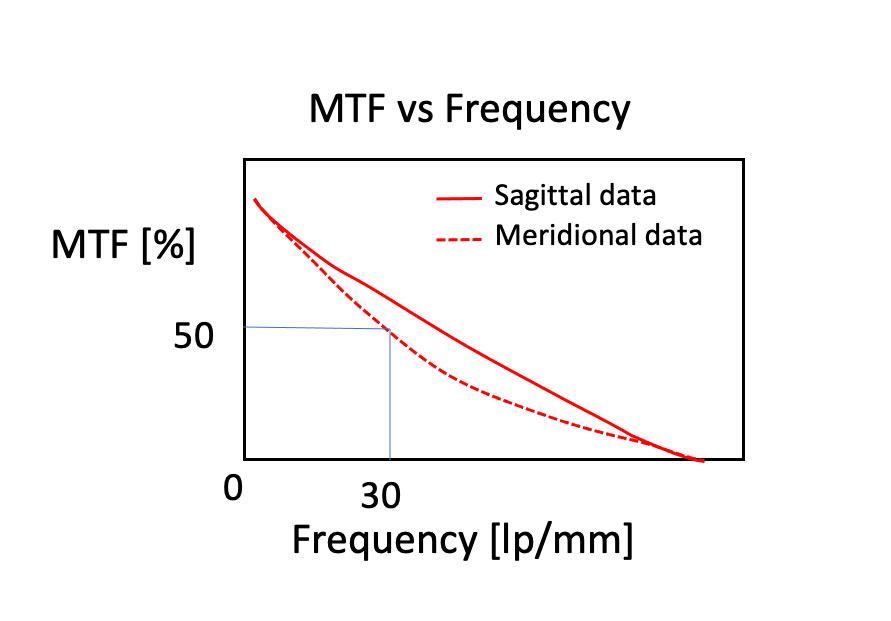
Figure 2. Example MTF chart showing contrast (MTF) vs. spatial frequency.
An MTF chart may also show curves in the sagittal and meridional directions. These curves illustrate how the contrast changes depending on the distance from the center of the image:
- Sagittal indicates the performance in the radial direction (from the center to the corner of the image)
- Meridional indicates the performance in the concentric direction (circular)
Note that the contrast is generally higher at the center of the field of view than at the edges for most lenses. The contrast in the sagittal and meridional directions change due to the influence of off-axis aberrations (i.e., optical errors at different field points). Examples include coma and astigmatism.
In general, similar sagittal and meridional characteristics creates a more uniform image. If the sagittal and meridional curves are closer to each other on an MTF chart, then the images will have more even image performance on both the X-axis (horizontal) and Y-axis (vertical). A gap generally indicates an uneven image with aberrations. Ideally, you want the curves to be closer to each other for more even image performance.
5 Ways to Use MTF Charts for Optical Instrument Design
When designing an optical instrument, engineers need to optimize many components to build a final system that meets all requirements. For instance, an optical system in a microscope-based imaging device includes an objective lens, tube lens, and camera adaptor. MTF charts provide an objective way (pun intended) to assess the performance of objective lenses and other optics used throughout the system.
1. Compare the optical performance against the ideal diffraction limit.
The diffraction limit indicates the absolute limit of the resolution in an optical system. By comparing the diffraction limit value with the MTF of the lens system, you can check how close the performance of the lens system is to the theoretical value.
An MTF chart can show you the difference between the ideal optical system and the constructed system at a glance. For example, let’s say you are comparing the MTFs of the two optical systems (Figure 3). You can see that System 1 has higher performance than System 2 because it is closer to the diffraction limit value.
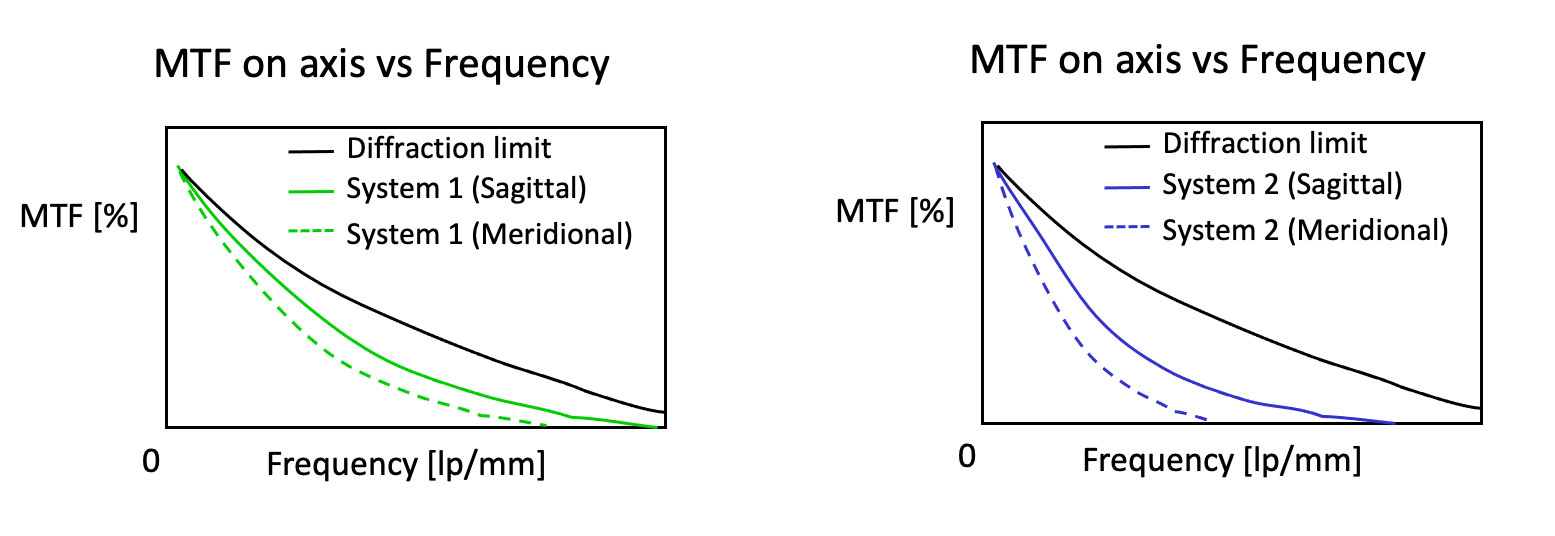
Figure 3. MTF curves of two optical systems. The side-by-side comparison enables you to see which system is closer to the diffraction limit.
2. Compare the performance of different objective lenses.
MTF is a good indicator when you want to compare the performance of different objective lenses since it shows which lens has a higher contrast at a certain spatial frequency. As we mentioned earlier, a higher contrast will lead to better image performance. MTF charts make it easy to compare the contrast of optics since you can visually see which MTF curve is higher.
Consider the MTF chart below (Figure 4) as an example. You can see the MTF performance of Optic A is better than Optic B since the curve is higher. This visual information can help you select the right objective lens for your system design.
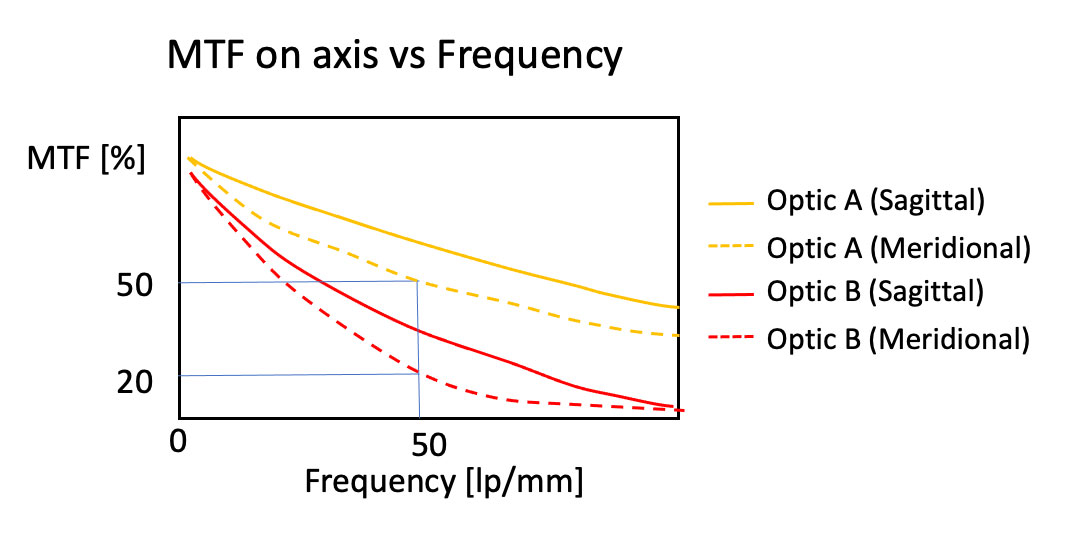
Figure 4. MTF curves of two different objectives. Optic A has a higher curve than Optic B, indicating that it has better optical performance.
3. Determine the MTF at different focus positions in the field of view.
An MTF chart can also show you how sensitive the optics are to defocusing by illustrating the MTF difference between on-axis and off-axis focus positions:
- On-axis focus position refers to the center of the field of view that provides a sharp, focused image
- Off-axis focus position refers to a position at the corner of the field
Let’s look at Figure 5 below as an example. The MTF at the on-axis focus position is 60%, and the MTF at the off-axis focus position is 40%. You can see that the off-axis MTF has deteriorated by 20%. The acceptable numbers vary depending on the application. If the numbers are unacceptable, consider changing the design or switching to different optical components.
Ideally, the MTF curve of the off-axis position should be as close as possible to that of the on-axis position to produce a focused image. A gap between the on-axis and off-axis curves (see Figure 5 below) indicates defocusing issues due to aberrations.
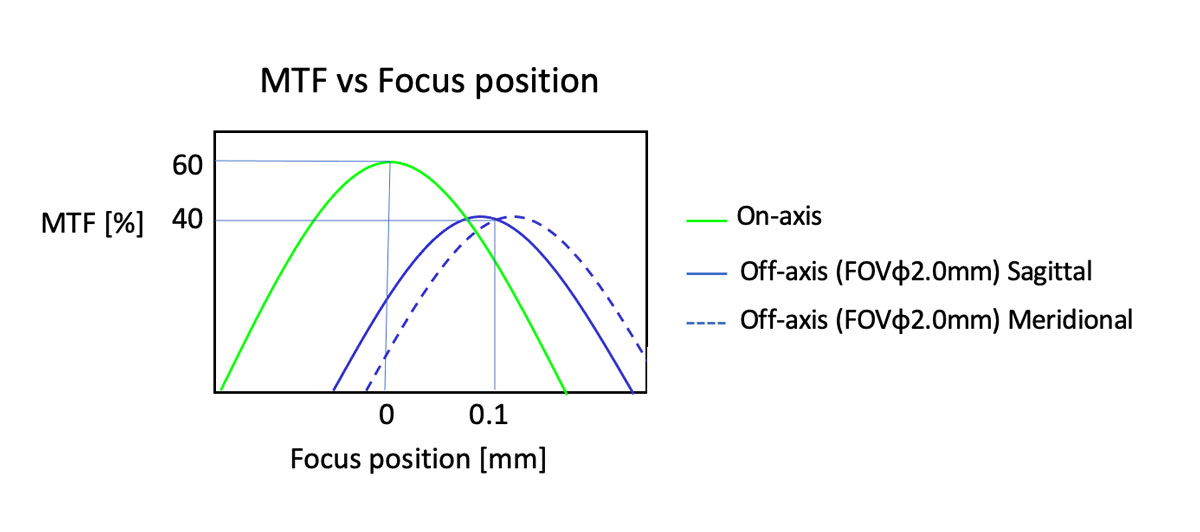
Figure 5. MTF curves at different focus positions (the peak of the curves) in the field of view. The gap between the on-axis and off-axis curves indicates defocusing issues.
4. Determine the ideal image height for the sensor.
Image height is the distance from the center to the edge of the image. An MTF chart enables you to visually determine the ideal image height at the sensor position of the optical system. You can also check the performance difference between the on-axis and off-axis sensor positions.
Figure 6 below shows an example. Take a look at the MTF at the center and off-axis positions of the sensor. The MTF at the center position is 70%. The MTF of meridional at 5 mm from the center is 50%. Normally, the farther away from the center, the more the MTF deteriorates due to the effects of off-axis aberrations. In this example, the MTF of meridional becomes 20% at 10 mm from the center. For optimal performance, make sure to check the MTF at the image height required for the application while building your system.
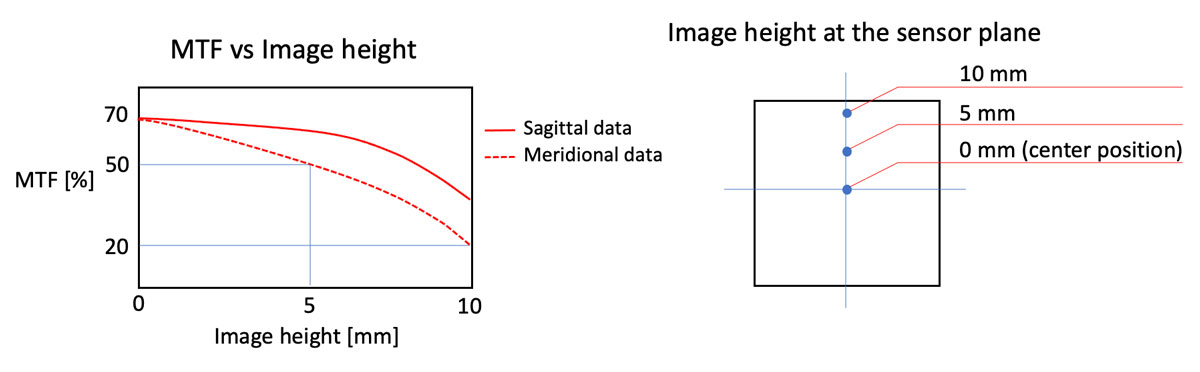
Figure 6. MTF chart for different image heights. The MTF deteriorates as it moves farther away from the center.
5. Compare the MTF for multiple optical components within a system.
Another useful way to use MTF charts is to check the MTFs of different optical components within a system, such as an objective and a tube lens. This enables you to see if there is any MTF deterioration due to one of the optical components. With this information, you can adjust the components to achieve the optimal performance needed for the system. For example, it is possible to calculate the MTF of an objective lens alone, a tube lens alone, and an optical system that combines an objective lens and a tube lens.
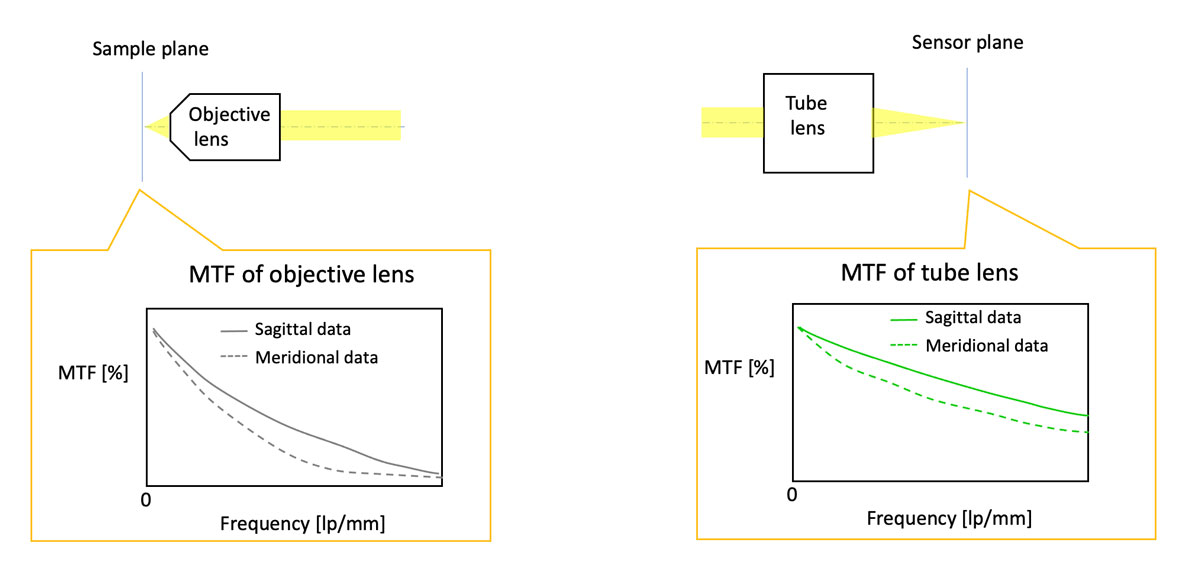
Figure 7. MTF charts for an objective lens (left) and a tube lens (right).
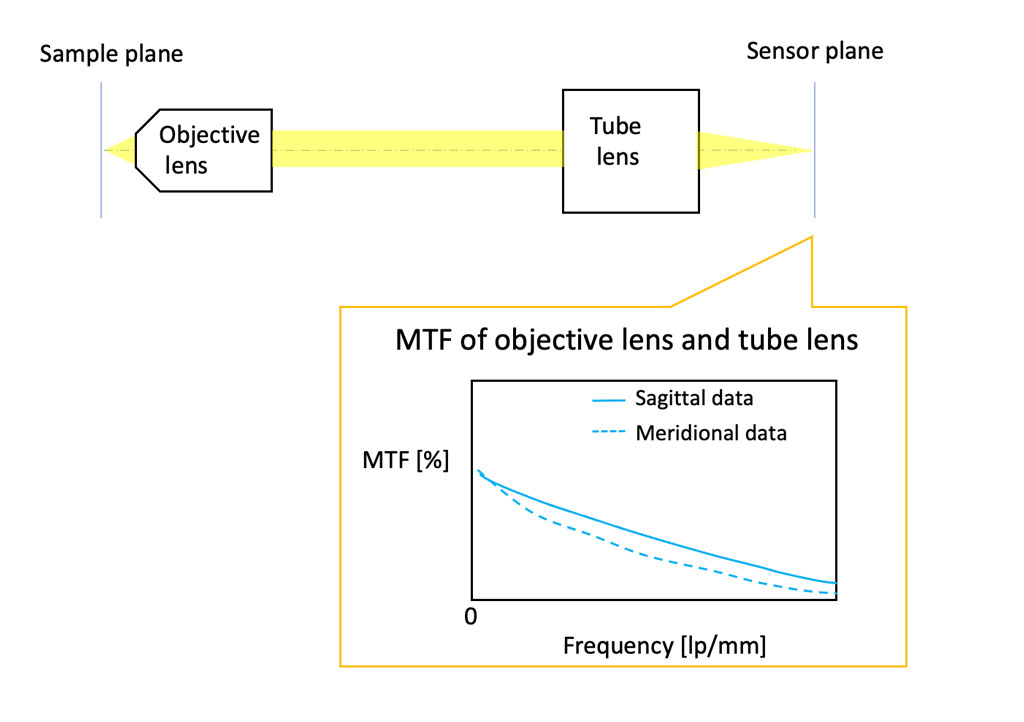
Figure 8. MTF chart showing the combined optical performance of the objective lens and tube lens.
MTF Chart Considerations and Further Reading
How you use MTF charts ultimately depends on the intended purpose of your instrument. For instance, MTF can be calculated for single wavelengths (monochromatic light) or for white light. Laser-based applications for fluorescence or multiphoton imaging may require MTF data for single wavelengths. Generic imaging applications may require MTF data for white light.
Another important consideration for MTF is the sensor. When evaluating an optical system with MTF, it is necessary to select a sensor with the optimal pixel pitch and Nyquist frequency. For more details, read our white paper, What to Consider When Choosing a Microscope Camera.
Have questions about MTF charts and data? Feel free to contact our experts for guidance.
Note: Evident discloses MTF data under the condition of a nondisclosure agreement (NDA). This data can be used to build an optical system with higher optical performance.
Related Content
How to Minimize an Optical System for a Compact Imaging Device