Drug Viability Testing of 3D Cancer Spheroids Using Automated Macro-to-Micro Imaging
Introduction
Microscopic observation is an effective way to evaluate the medicinal effects of anticancer drugs on spheroids or organoids. However, the imaging workflow can be time consuming since it requires spending time at the microscope to find your sample and perform imaging.
We developed automated macro-to-micro imaging, an innovative imaging module that dramatically improves the efficiency of this work. Automated macro-to-micro imaging can replace manual microscope operations with automated imaging and object detection. In this application note, we introduce a case study on drug viability testing of 3D cancer spheroids using automated macro-to-micro imaging.
Materials and Methods: Sample Preparation
Human breast cancer cell line MCF-7 cells were seeded at 2,000 cells/well in a 96-well U plate (PrimeSurface, Sumitomo Bakelite). On the third day of culture, anticancer drugs (Paclitaxel, 5-FU, Cisplatin) were added at various concentrations. After 24 hours of culture, Hoechst 33342, propidium Iodide (PI), and Calcein-AM were added and incubated for one hour. Nuclei of all cells were stained with Hoechst33342, nuclei of dead cells were stained with PI, and live cells were stained with Calcein-AM. The cells were then observed using the automated macro-to-micro software module on the Olympus FV3000 confocal laser scanning microscope.
How Does Automated Macro-to-Micro Imaging Work?
With automated macro-to-micro imaging, the following operations can be performed automatically by simply setting the observation methods in advance.
First, automated macro-to-micro imaging takes an overview image of the entire well (including the Z-axis) using a low magnification objective lens (1.25X to 4X objective). Based on the obtained image (macro image), the position and thickness of the sample in each well are automatically detected. Then, the optimal imaging position (XYZ) is calculated, and the sample is imaged in detail using a high magnification objective lens (micro image). If the sample is larger than the field of view of the objective lens used in micro imaging, the system can automatically stitch multiple images together (Figure 1).
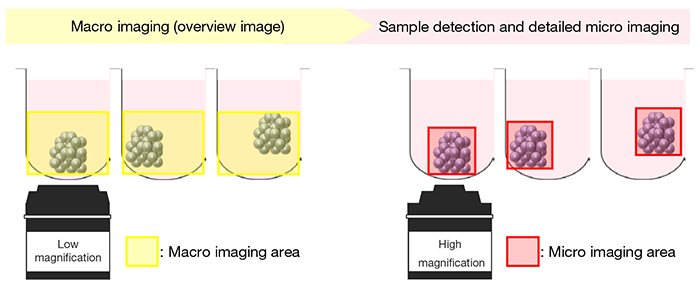
Figure 1. Macro-to-micro schematic image
The microscope operation takes about 15–20 minutes and is only needed when the initial observation methods are set. After automated macro-to-micro imaging is executed, the user can leave the microscope and PC to perform other tasks while the imaging finishes. As a result, the time spent operating the microscope is drastically reduced. In addition, even if the thickness or position of the sample varies among the wells, the system can image with the optimal Z-range for each sample. This speeds up the imaging time and reduces the amount of imaging data.
Macro-to-Micro Imaging Steps
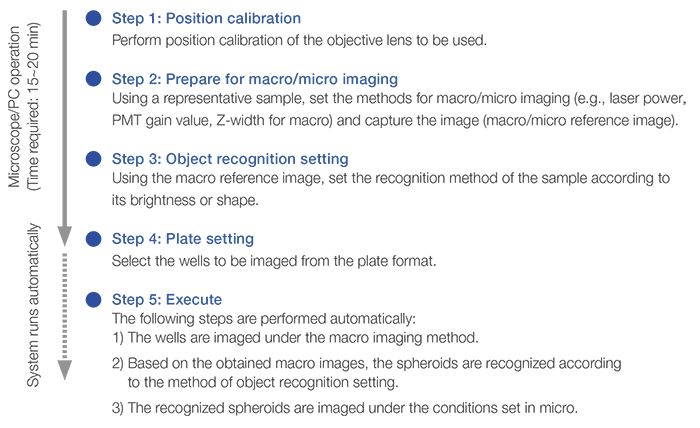
Imaging Results
MCF7 spheroids treated with various anticancer drugs were stained with Calcein-AM and PI to visualize viability. By using our automated macro-to-micro imaging module for the FV3000 confocal microscope, we could quickly acquire high-resolution images of 60 wells taken at appropriate positions. The microscope operation only took 15 minutes (Figure 2).
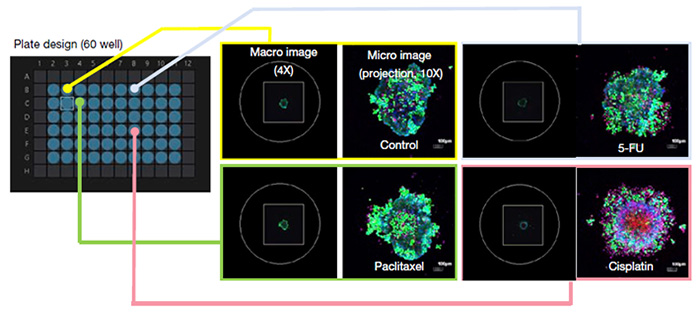
Figure 2. Adaptation of the automated macro-to-micro imaging module for a viability test of anticancer drugs
The conventional observation workflow requires you to specify the position of the sample one well at a time to obtain the appropriate imaging conditions. By using the automated macro-to-micro imaging module, this work is eliminated. Further, the time spent imaging can be used for other tasks, driving work efficiency.
Analysis Results
By opening the image files acquired by the automated macro-to-micro imaging module with NoviSight™ 3D cell analysis software, multi-well images can be analyzed in 3D at once.
All nuclei were recognized by the intensity of MCF7 Hoechst33342. Viability was evaluated by classifying whether the recognized nuclei were living or dead cells according to the intensity of Calcein-AM and PI. As a result, we could successfully evaluate viability for each anticancer drug at the single-cell level, consistent with known reports (Figure 3 and Figure 4).
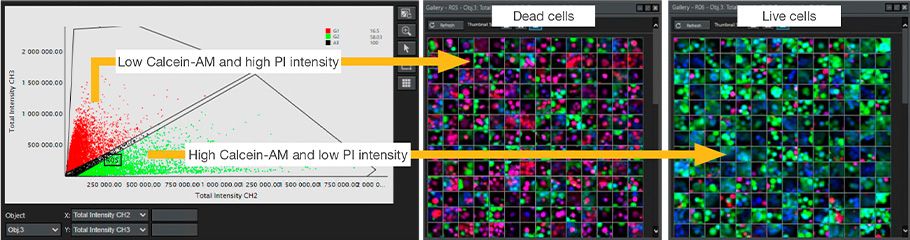
Figure 3. NoviSight analysis for live/dead classification using Calcein-AM/PI intensity
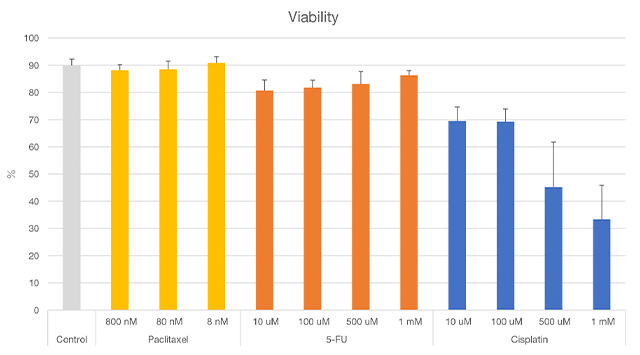
Figure 4. Results of spheroid viability using NoviSight analysis
Conclusion
By using the automated macro-to-micro imaging module, we could image 60 wells of the microplate at appropriate image positions after about 15 minutes of operating the microscope and PC.
We anticipate that the manual imaging of one well at a time would require more than six hours of intermittent operation in front of the microscope and PC, including the imaging time. With the automated imaging module, you only need to spend about 15 minutes operating the microscope and PC and have the flexibility to perform other tasks while the imaging finishes.
Moreover, by combining the automated macro-to-micro imaging and NoviSight software, the multi-well images could be analyzed in batches. This setup enables a seamless workflow from image acquisition to analysis of multi-well spheroid samples.
Mayu Ogawa
Researcher, R&D – Olympus Corporation
Products Related to This Application
Sorry, this page is not
available in your country.