Fluorescence Excitation and Emission Fundamentals
Fluorescence Excitation and Emission Fundamentals
Fluorochromes are photoreactive chemical compounds that absorb light energy of a certain wavelength and emit that light at a longer wavelength. This capacity makes them useful as detection reagents in the study of cells and tissues. Because of their novel electronic configurations, fluorochromes have unique and characteristic spectra for absorption (usually similar to excitation) and emission. These absorption and emission spectra show relative intensity of fluorescence, with the relative intensity classically plotted on the vertical axis versus wavelength on the horizontal axis. For a given fluorochrome, the manufacturers indicate the wavelength for the peak of the illumination excitation intensity and the wavelength for the peak of fluorescence emission intensity. It is important to understand the origin of these graphs and curves displaying the excitation and emission spectra for a given fluorochrome.
How to Determine the Emission Spectrum of a Fluorochrome
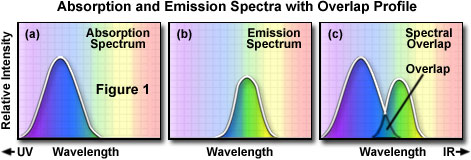
To determine the emission spectrum of a particular fluorochrome, the wavelength of maximum absorption (usually the same as the excitation maximum) is determined and the fluorochrome is excited at that wavelength. The absorption spectrum of a typical fluorochrome is illustrated in Figure 1(a) where the relative intensity of absorption is plotted against the measured wavelength. A monochromator (a device that allows narrow bands of light wavelengths to pass) is then used to scan the fluorescence emission intensity over the entire series of emission wavelengths. The relative intensity of the fluorescence is measured at the various wavelengths to plot the emission spectrum, as illustrated in Figure 1(b). The excitation spectrum of a given fluorochrome is determined in a similar manner by monitoring fluorescence emission at the wavelength of maximum intensity while the fluorophore is excited through a group of consecutive wavelengths. The emission maximum is chosen and only emission light at that wavelength is allowed to pass to the detector. Excitation is induced (usually by means of a monochromator) at various excitation wavelengths and the intensity of the emitted fluorescence is measured as a function of wavelength. The result is a graph or curve (illustrated in Figure 1(a)), which depicts the relative fluorescence intensity produced by excitation over the spectrum of excitation wavelengths.
Fluorescence Filter Spectra
Explore the overlap regions of fluorescence excitation, emission, and dichromatic filter spectral profiles and how changes in the transmission characteristics determine the bandwidth of wavelengths passed through various filter combinations.
Observations from Excitation and Emission Spectrums
Several observations can be made from a typical excitation and emission set of curves or spectra. There is usually an overlap between the higher wavelength end of the excitation spectrum and the lower wavelength end of the emission spectrum. In fluorescence microscopy, this overlap of excitation and emission intensities and wavelengths (Figure 1(c)) must be eliminated by selecting the appropriate excitation filter, beamsplitter (reflected light fluorescence), and emission filter. Otherwise, the much brighter excitation light overwhelms the weaker emitted fluorescence light and significantly diminishes specimen contrast.
Stokes’ Law
When electrons go from the excited state to the ground state, there is a loss of vibrational energy (for information on this phenomenon, see Molecular Explanation of Fluorescence). Since wavelength is inversely proportional to radiation energy ( ), the energy loss shifts the emission spectrum to longer wavelengths than the excitation spectrum. This phenomenon is known as Stokes’ Law or Stokes’ shift as it was found by Sir George G. Stokes in the middle of the nineteenth century. The greater the Stokes’ shift, the easier it is to separate excitation light from emission light. To achieve maximum fluorescence intensity, the fluorochrome is optimally excited at the peak excitation wavelength, and the emission detection is selected at the peak wavelength (or other wavelengths chosen by the observer) of the emission curve. The selections of excitation wavelengths and emission wavelengths are controlled by appropriate filters that restrict what wavelengths of light are allowed to pass. When determining the spectral response of entire optical system, additional technical corrections are required to take into account factors like glass transmission and detector sensitivity that vary for different wavelengths.
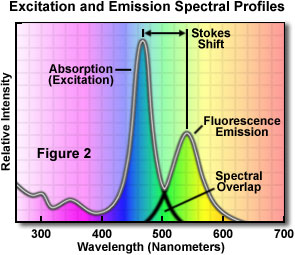
A typical fluorochrome absorption-emission spectral diagram is illustrated in Figure 2. Note that the curves of fluorescence intensity for absorption (usually similar to the excitation curve for pure compounds) and emission for this typical fluorochrome are somewhat similar in shape. Also note that the excitation and emission curves overlap somewhat at the upper end of the excitation and the lower wavelengths of the emission curve.
Fluorescence Filter Cubes
Discover how variations in the bandpass wavelength region of excitation and barrier filters allow a specific band of wavelengths to illuminate the specimen, and then pass through to the detector while all others are excluded.
The Separation of Excitation and Emission Wavelengths
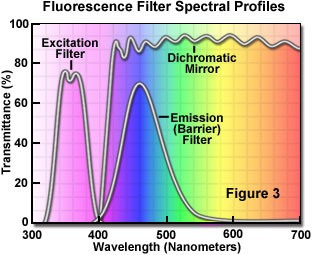
The separation of excitation and emission wavelengths is achieved by the proper selection of filters to block or pass specific wavelengths of the spectrum as presented in Figure 3. The design of fluorescence illuminators is based on control of excitation light and emission light by readily changeable filter insertions into the light path on the way toward the specimen(excitation) and then emanating from the specimen (emission). It is important, in view of low emission intensities, that the light source chosen for excitation be of sufficient brightness so that the relatively weak emission light can be maximized, and that fluorochromes of satisfactory absorption and yield be chosen.
The efficiency with which the fluorochrome absorbs the excitation light is known as the molecular extinction coefficient. The greater the molecular extinction coefficient, the greater the possibility of light absorption in a given wavelength region (a prerequisite to ensuing fluorescence emission). The yield of emitted light is referred to as the quantum yield, the ratio of the number of quanta ("packets" of energy) emitted compared to the number of quanta absorbed (many commercial fluorochromes have yields between 0.1 and 0.9). Quantum yields below 1 are the result of the loss of energy through non-radiative pathways, such as heat or a photochemical reaction, rather than the re-radiative pathway of fluorescence. Listed below in Table 1 are fluorescence quantum yields for a group of selected fluorochromes. Notice that some quantum yields seem trivial (benzene) while others are very efficient (Fluorescein and Rhodamine-B).
Fluorochrome Fluorescence Quantum Yields
Table 1
| Compound | Solvent | Excitation
Wavelength (nm) | Emission
Wavelength (nm) | Quantum Yield |
|---|---|---|---|---|
| Acridine Orange | Ethanol | 493 | 535 | 0.46 |
| Benzene | Ethanol | 248 | 300-350 | 0.04 |
| Chlorophyll-A | Ethanol | 440 | 685 | 0.23 |
| Eosin | Water | 521 | 544 | 0.16 |
| Fluorescein | Water | 437 | 515 | 0.92 |
| Rhodamine-B | Ethanol | 555 | 627 | 0.97 |
Molecular extinction coefficient, quantum yield, mean luminous intensity (intrinsic brightness) of the light source, and fluorescence lifetime (excited state duration) are all important factors contributing to the intensity and utility of fluorescence emission. In addition, the localized environment surrounding the fluorochrome plays a paramount role in determining the characteristics of fluorescence emission. Variables such as solvent viscosity, ionic concentrations, pH, and hydrophobicity in the environment can have profound effects on both the fluorescence intensity and the lifetime of the excited state.
Molecular Explanation of Fluorescence
Another way to depict fluorescence activity is to use a Jablonski diagram like the one shown in Figure 4(a). Prior to excitation, the electronic configuration of the molecule is described as being in the ground state. Upon absorbing a photon of excitation light, electrons may be raised to a higher energy and vibrational excited state in just a few femtoseconds (10-15 seconds).
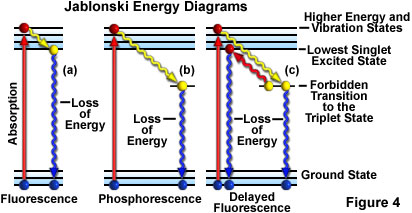
During an interval of approximately a trillionth of a second (a picosecond or 10-12 seconds), the excited electrons may lose some vibrational energy to the surrounding environment and return to what is called the lowest excited singlet state. From the lowest excited singlet state, the electrons are then able to "relax" back to the ground state with simultaneous emission of fluorescent light as illustrated in Figure 4(a). The emitted light is always of longer wavelength than the excitation light (Stokes Law) and continues so long as the excitation illumination bathes the fluorescent specimen. If the exciting radiation is halted, the fluorescence ceases.
Jablonski Energy Diagram
Explore how an electron absorbs energy and transcends to a higher energy state according to a Jablonski energy-level diagram. Once an electron is in the excited state, it slowly relaxes through vibrational effects and can then drop back to the ground state by emitting a photon (fluorescence).
Occasionally the excited electrons, instead of relaxing to the lowest singlet state through vibrational interactions, make a forbidden transition to the exited triplet state and then to the ground state in a process where the emission of radiation may be considerably delayed up to several seconds or more. This phenomenon is characteristic of phosphorescence, as shown in Figure 4(b). In some instances, the excited electrons may go from the triplet state back to the lowest excited singlet state and then return to the ground state, subsequently emitting fluorescent light. This action takes a little longer (about a microsecond or two) than usual fluorescence and is called delayed fluorescence (Figure 4(c)). Under other circumstances (for example, photobleaching or the presence of salts of heavy metals or other chemicals), emitted light may be significantly reduced or halted altogether.
Fading or Photobleaching
There are specific conditions that may affect the re-radiation of light by an excited fluorophore, and thus reduce the intensity of fluorescence. This reduction of emission intensity is generally called fading or photobleaching. Some authors further subdivide fading into quenching and bleaching. Bleaching is irreversible decomposition of the fluorescent molecules because of light intensity in the presence of molecular oxygen. Quenching also results in reduced fluorescence intensity and frequently is brought about as a result of oxidizing agents or the presence of salts of heavy metals or halogen compounds.
Often, quenching results from the transfer of energy to other acceptor molecules physically close to the excited fluorophores, a phenomenon known as resonance energy transfer. This particular phenomenon has become the basis for a newer technique of measuring distances far below the lateral resolution of the light microscope.
The occurrence of bleaching has led to a technique known as FRAP, or fluorescence recovery after photobleaching. FRAP utilizes bleaching through short laser bursts, enabling subsequent observation of the recovery of fluorescence caused by the diffusion of fluorophores into the bleached area.
Properties of Popular Antifade Reagents
Table 2
| Antifade Reagent | Comments |
|---|---|
| p-phenylene-diamine | The most effective reagent for FITC. Also effective for Rhodamine. Should be adjusted to 0.1% p-phenylenediamine in glycerol/PBS for use. Reagent blackens when subjected to light exposure so it should be stored in a dark place. Skin contact is extremely dangerous. |
| DABCO (1,4-diazabi-cyclo-2,2,2-octane) | Highly effective for FITC. Although its effect is slightly lower than p-phenylenediamine, it is more resistant to light and features a higher level of safety. |
| n-propylgallate | The most effective reagent for Rhodamine, also effective for FITC. Should be adjusted to 1% propylgallate in glycerol/PBS for use. |
| 2-mercapto-ethylamine | Used to observe chromosome and DNA specimens stained with propidium iodide, acridine orange, or Chromomysin A3. Should be adjusted to 0.1mM 2-mercaptotheylamine in Tris-EDTA |
To reduce the degree of fading in some specimens, it may be advisable to use a neutral density filter in the light path before the illumination reaches the excitation filter, thus diminishing the excitation light intensity. In other instances, fading effects may be reduced by changing the pH of the mounting medium or by using anti-bleaching agents (several of the more important agents are listed in Table 2). For digital imaging, photomicrography, or simply visual observation, rapidly changing the field of view may also avoid fading effects.
Sorry, this page is not
available in your country.