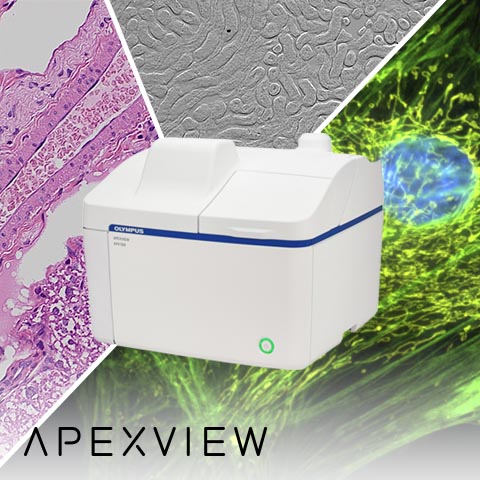
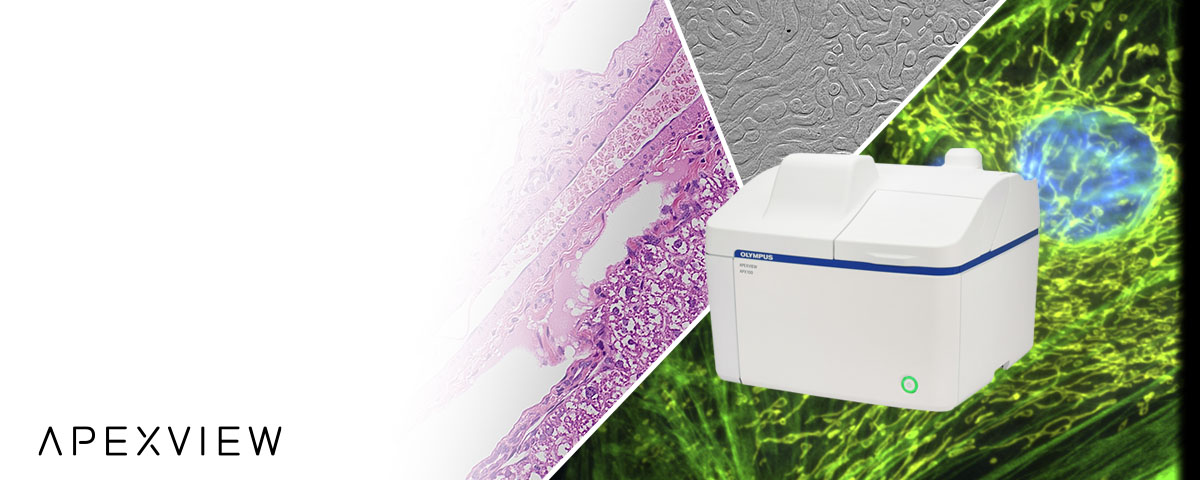
The APEXVIEW APX100 benchtop fluorescence microscope supports a wide range of observation methods. With easy-to-use, convenient functions and intuitive software, it makes diverse research applications more efficient while not compromising on image quality.
This gallery showcases application examples captured using an APX100 digital imaging system. If you have any questions about how it can be used in your applications, let us know!
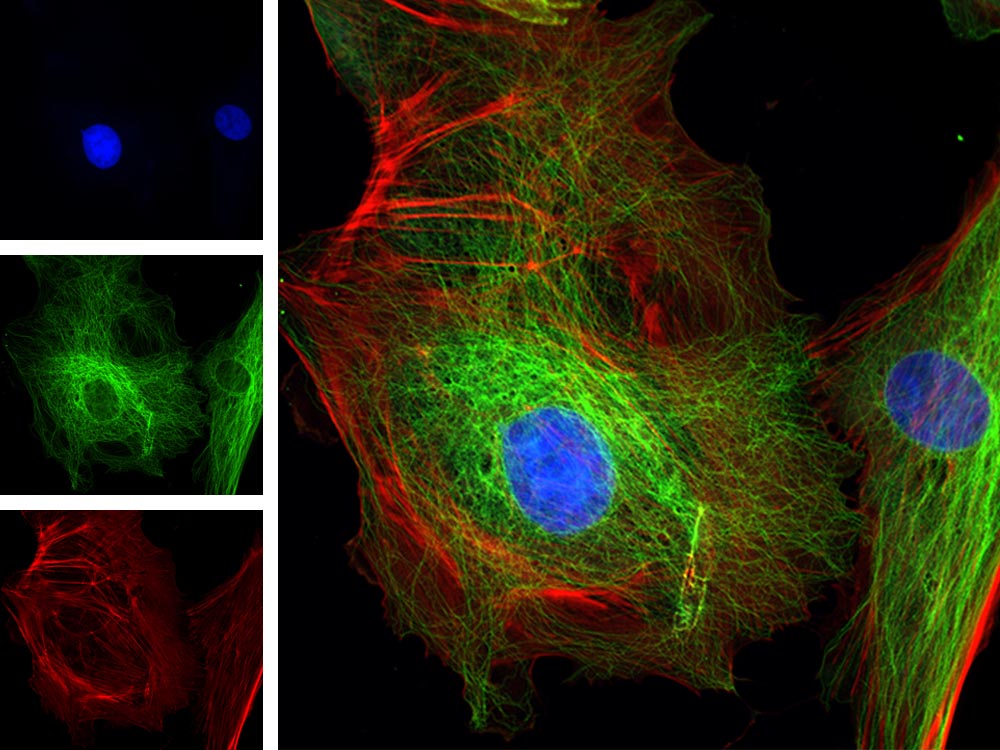 | Multichannel Fluorescence
BPAE cells. Stain: Mouse Anti-α-tubulin, BODIPY FL Goat Anti-Mouse IgG, Texas Red-X Phalloidin, DAPI. |
|---|
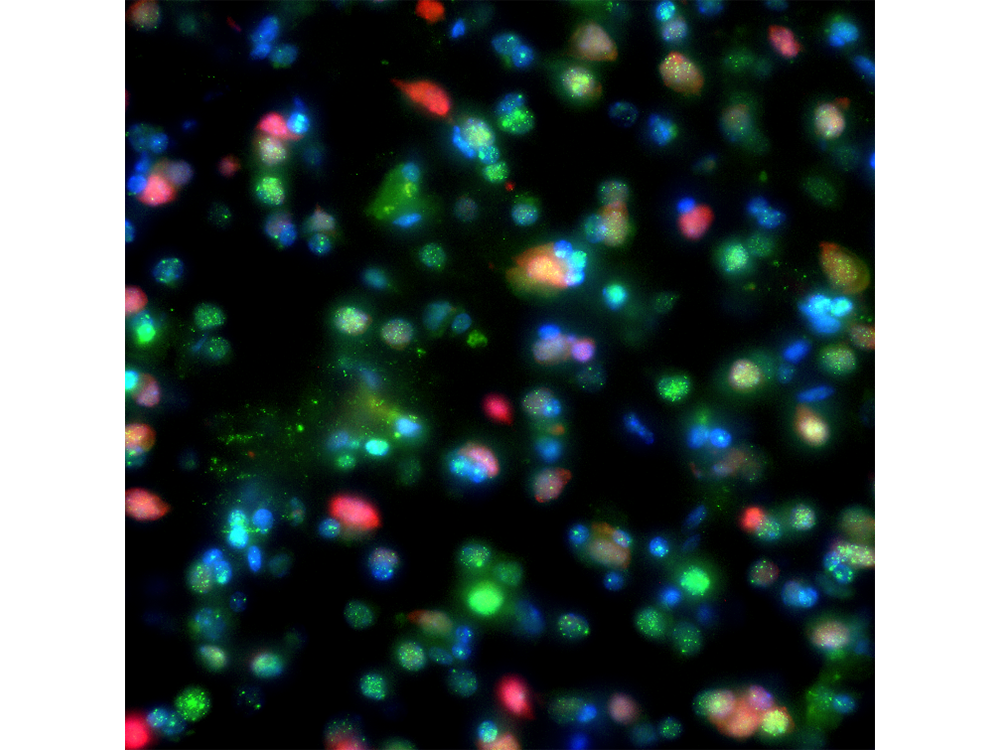
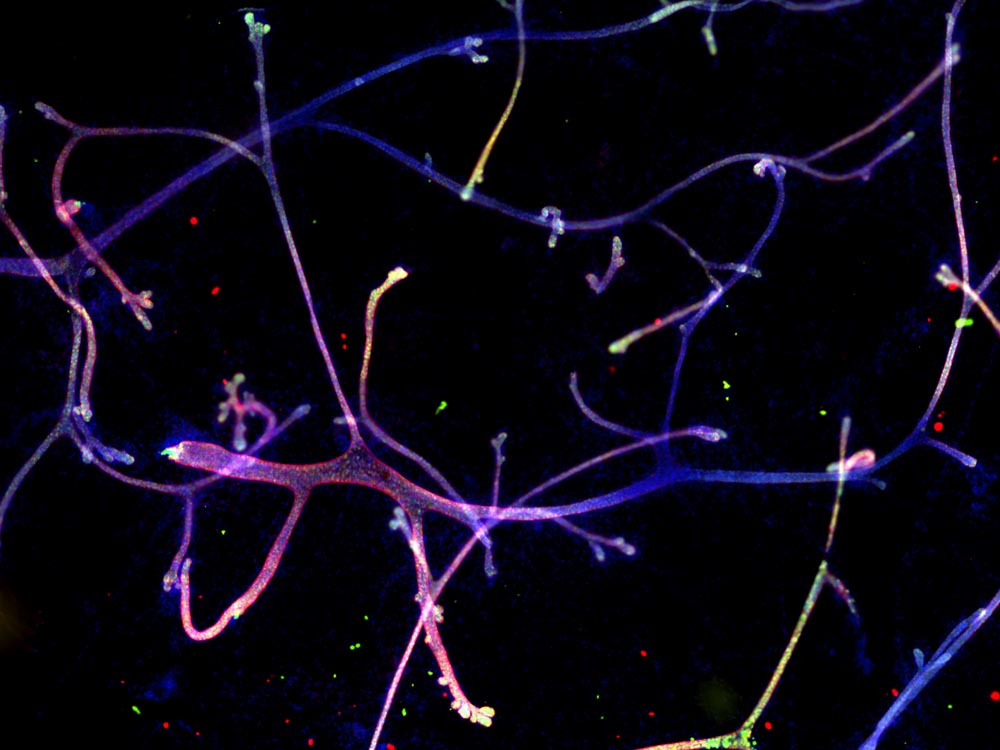
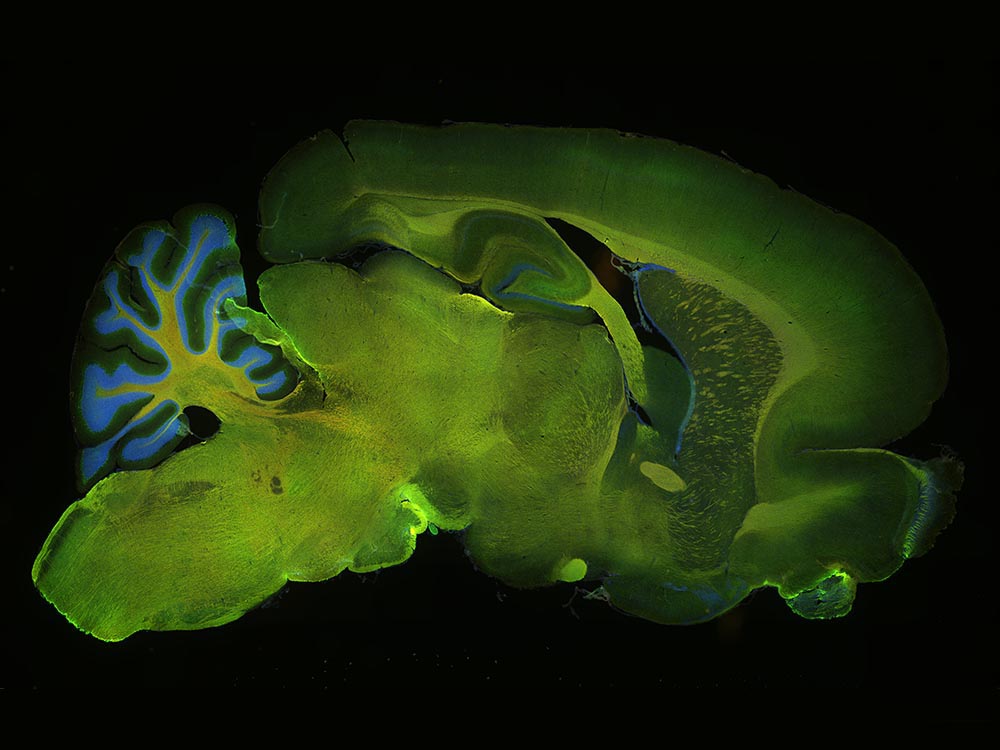
Rat cerebellum labeled using 5 fluorochromesEasily acquire multichannel fluorescence images with wavelengths ranging from UV to NIR. Stains used: Hoechst (blue), GFAP (green), MAP2 (orange), Calbindin (red), MBP (magenta). Objective: UPLXAPO4X | 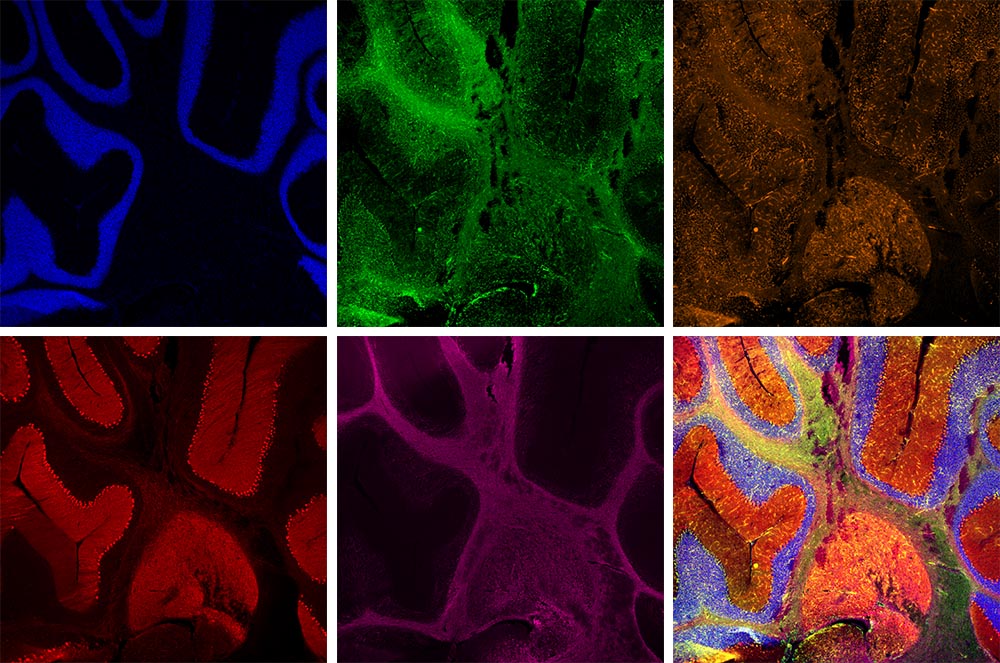 |
|---|
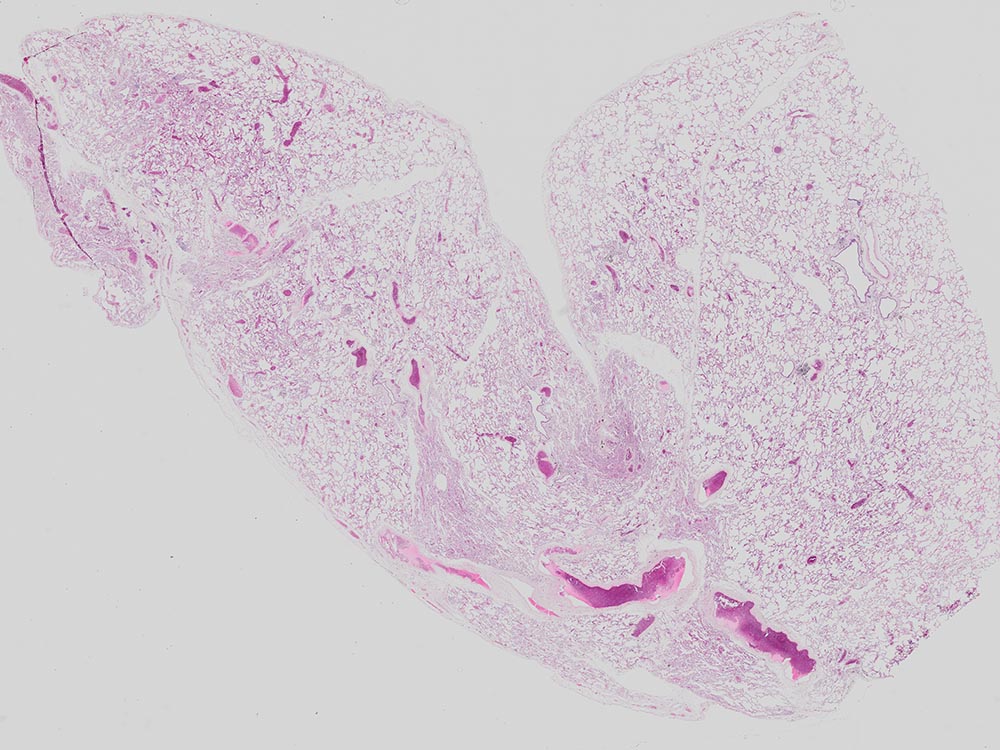 | Stitching
Mouse lung captured with UPLXAPO4X objective. Stain: HE. |
|---|
Z-Stack
Subcellular localization of kendrin/pericentrin, centrosome protein. Image data courtesy of Kazuhiko Matsuo, Ph.D., Division of Developmental Biology and Anatomy, Department of Anatomy, Kyoto Prefectural University of Medicine. | 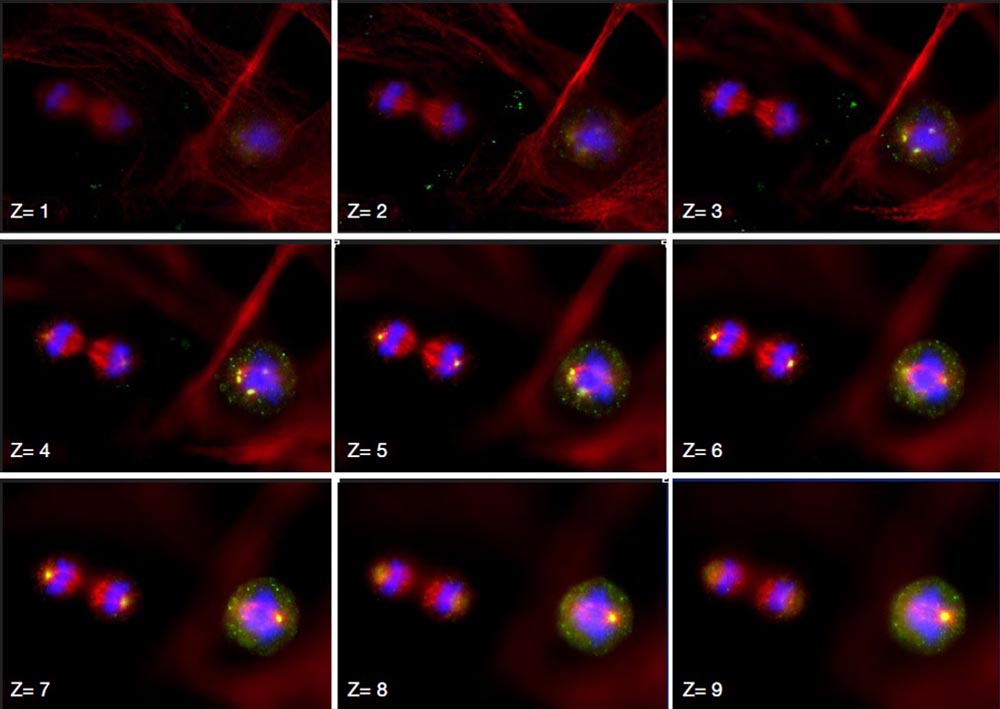 |
|---|
Time-Lapse Imaging
- Continuously record changes in a live cell or entire culture over time.
- A built-in vibration-isolation mechanism and optional incubator help ensure stable image acquisition.
- When combined with the optional drug administration unit, you can observe the response of cells immediately after drug administration in real time.
Scratch assay
Scratch assay time-lapse imaging of Human Aoritic Enodothelial Cells (HAEC) (2 days).
| Fertilized mouse egg4-hours time-lapse observation of a fertilized mouse egg. |
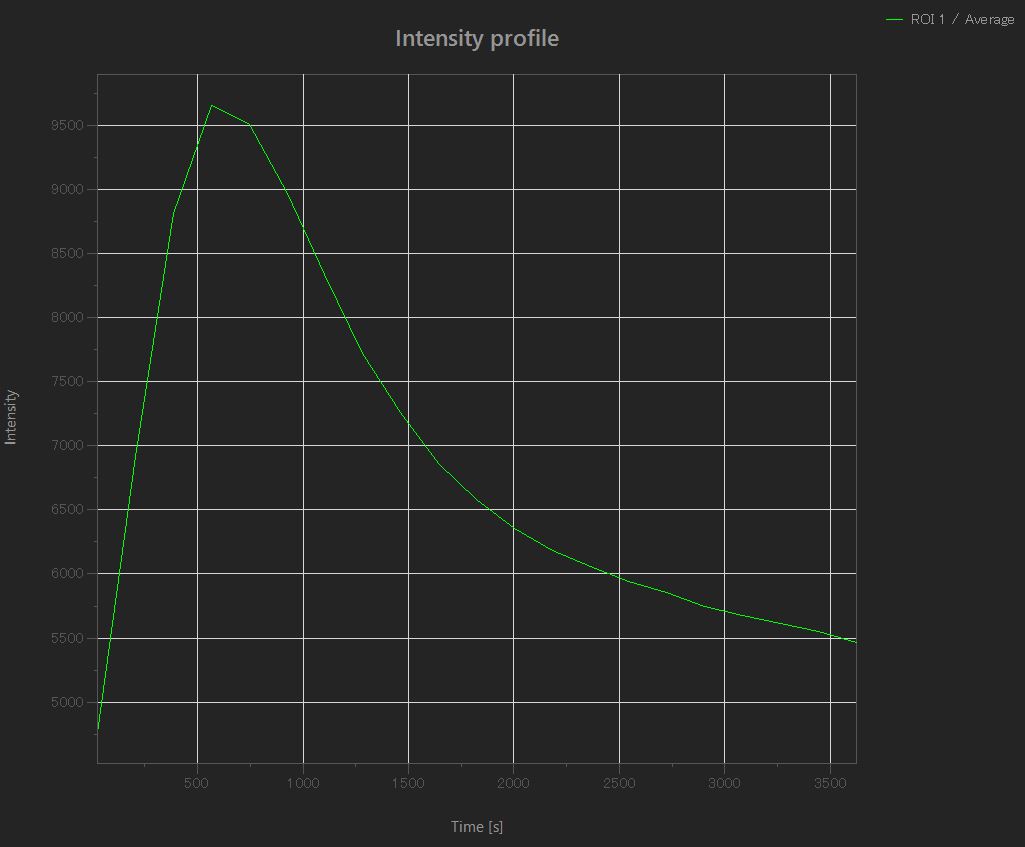
Antioxidant effects in mitochondria
Mitochondria that are oxidized (intensity increased) by the addition of H2O2 are subsequently reduced (intensity decreased) by the antioxidant effect.
|
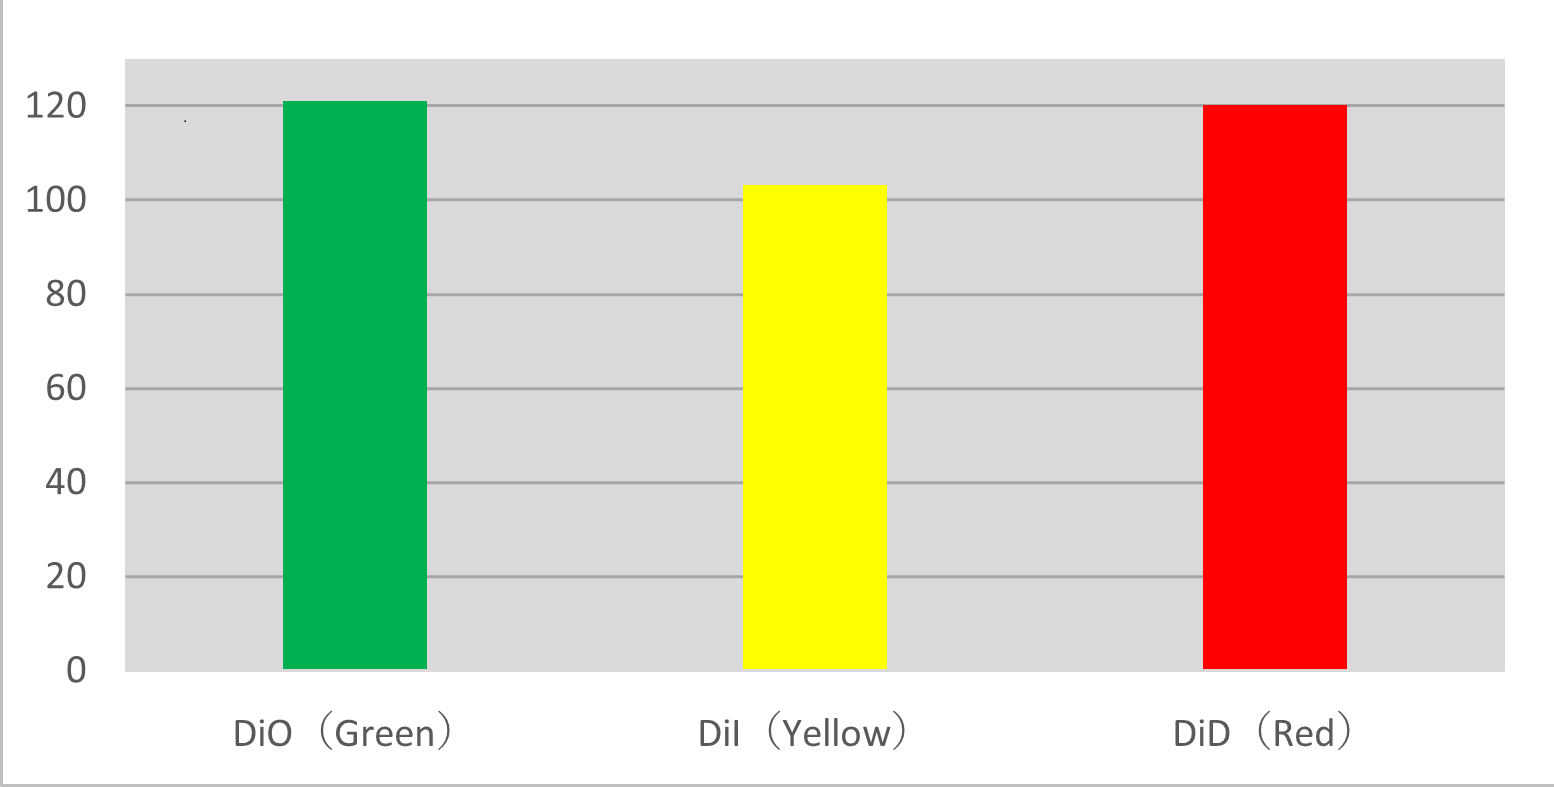
Multicolor imaging of migrating RBL-2H3 cells
Three types of treated RBL-2H3 cells were mixed, and their migratory state was observed using multicolor time-lapse imaging. The cells of allt treatments showed similar migration by tracking analysis.
|
Fluorescence Imaging
|
|
|
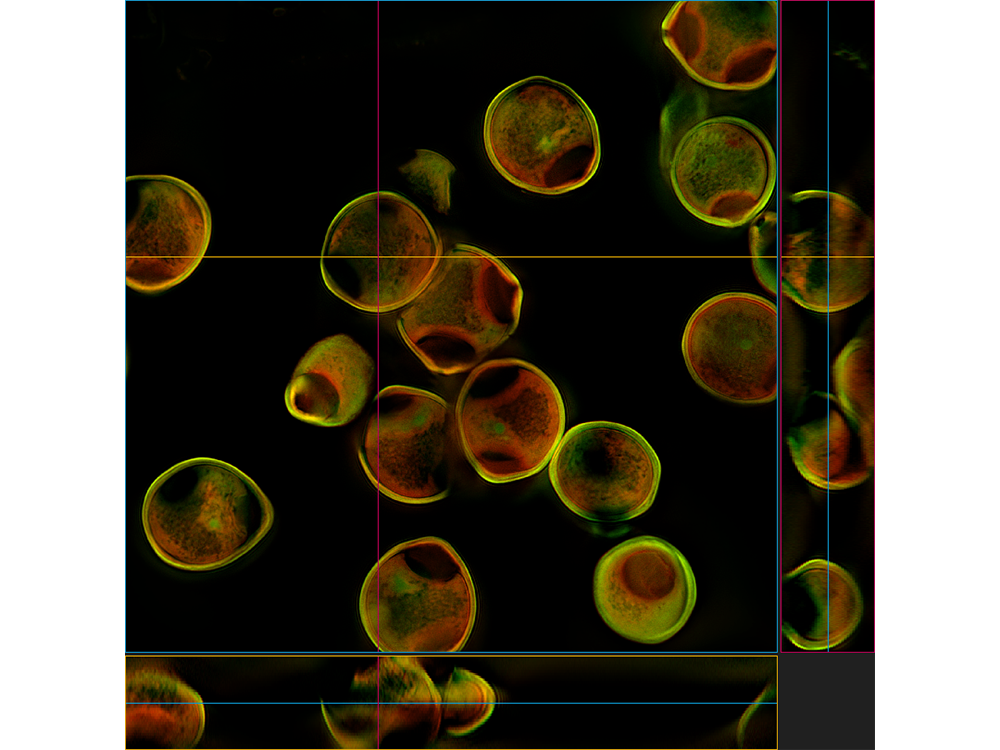
Fluorescence in-situ hybridization (FISH) sampleCaptured with a UPLXAPO60XO X Line™ objective. | Colocalization of NeuN and γ-H2AX in a monkey brainStain: Immunocytochemistry. Image data courtesy of Rui Han, Lab of Professor Xiaojiang-Li, Guangdong-HongKong-Macau Institute of CNS Regeneration, Jinan University. | Hazel pollenAutofluorescence, captured with a UPLXAPO60X oil objective. Processed with TruSight deconvolution. |
|
|
|
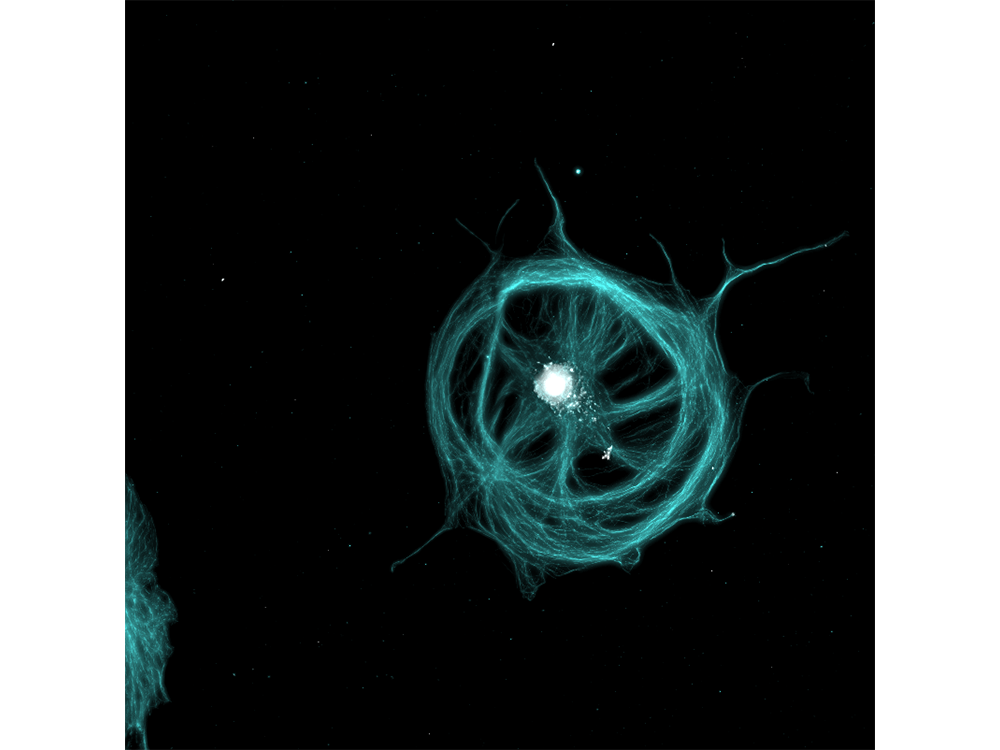
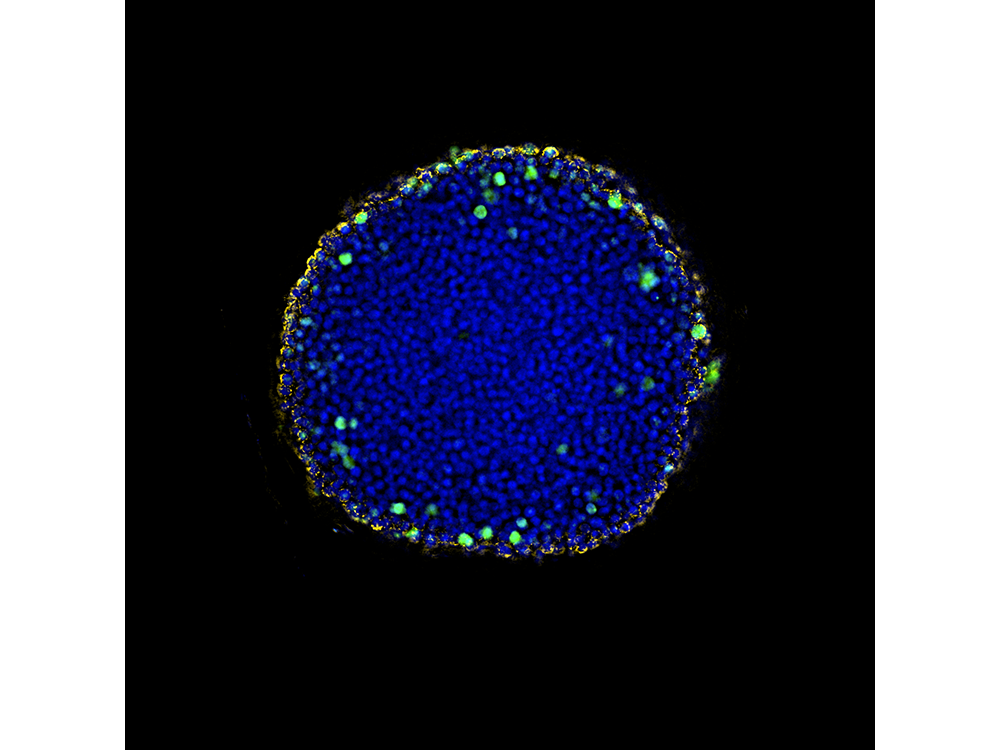
Mammary gland of adult mouse (Krt14/Krt8)Stain: Immunocytochemistry. Image data courtesy of Chunye Liu, Lab of Prof. Yi Zeng, Center of Excellence in Molecular Cell Science, CAS. | Tubulin and nucleus of BSC-1 cellsStain: Immunocytochemistry, White: cell nucleus, Cyan: Tubulin. | Cleared HeLa cell spheroidStain: Immunocytochemistry, Blue: DAPI Nucleus, Green: AF488 Ki67, Red: AF555 Actin. |
|
|
|
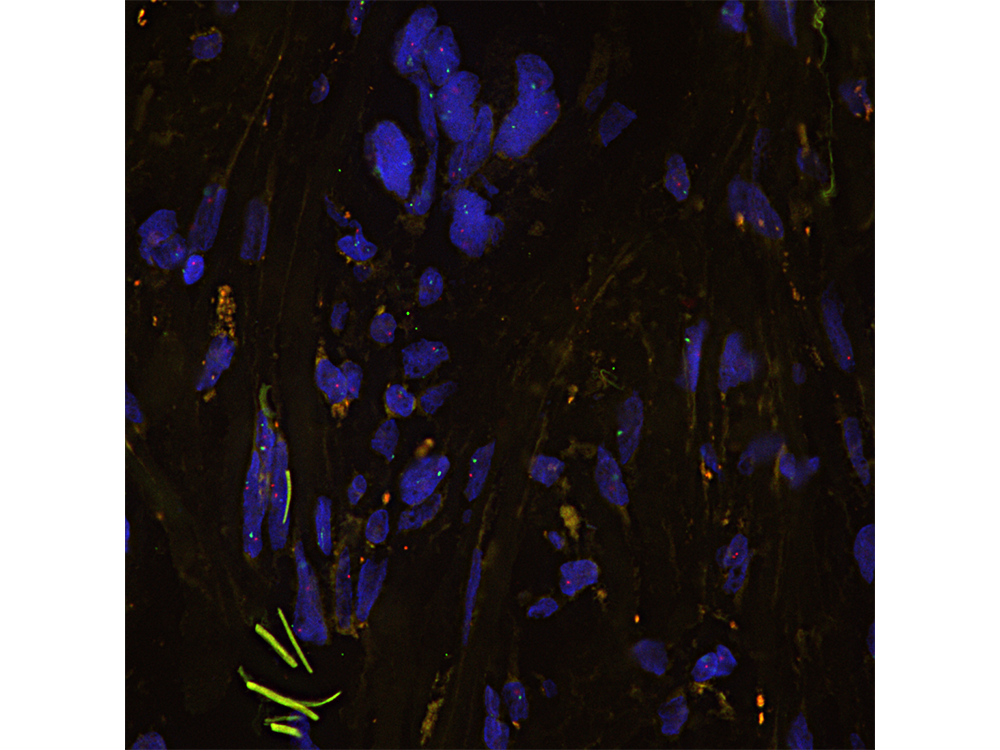
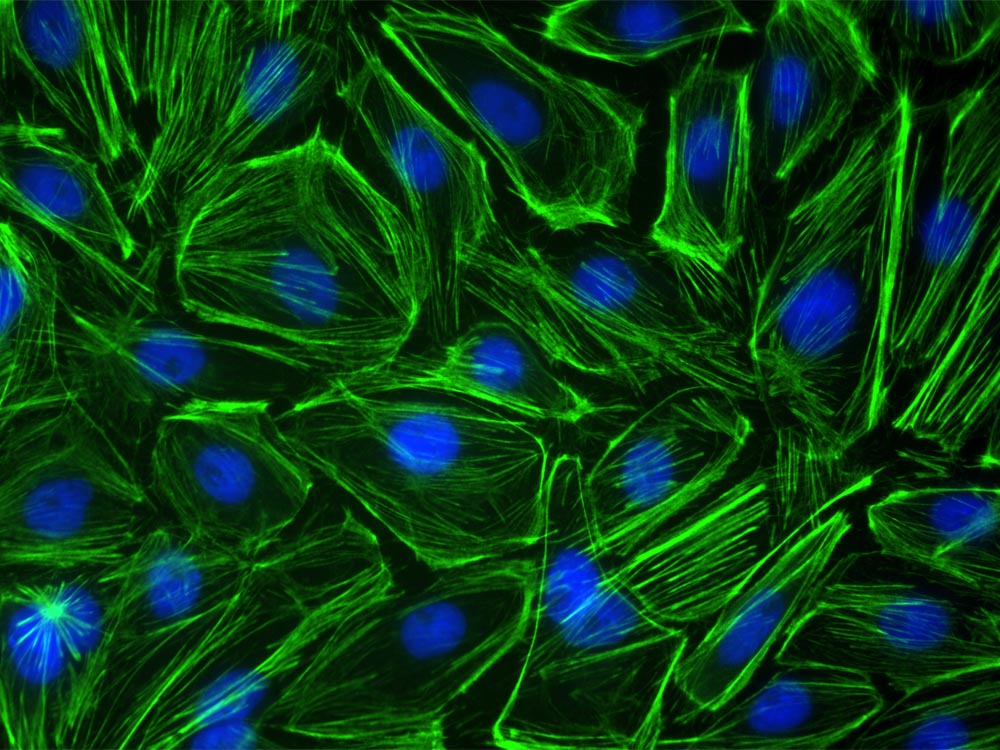
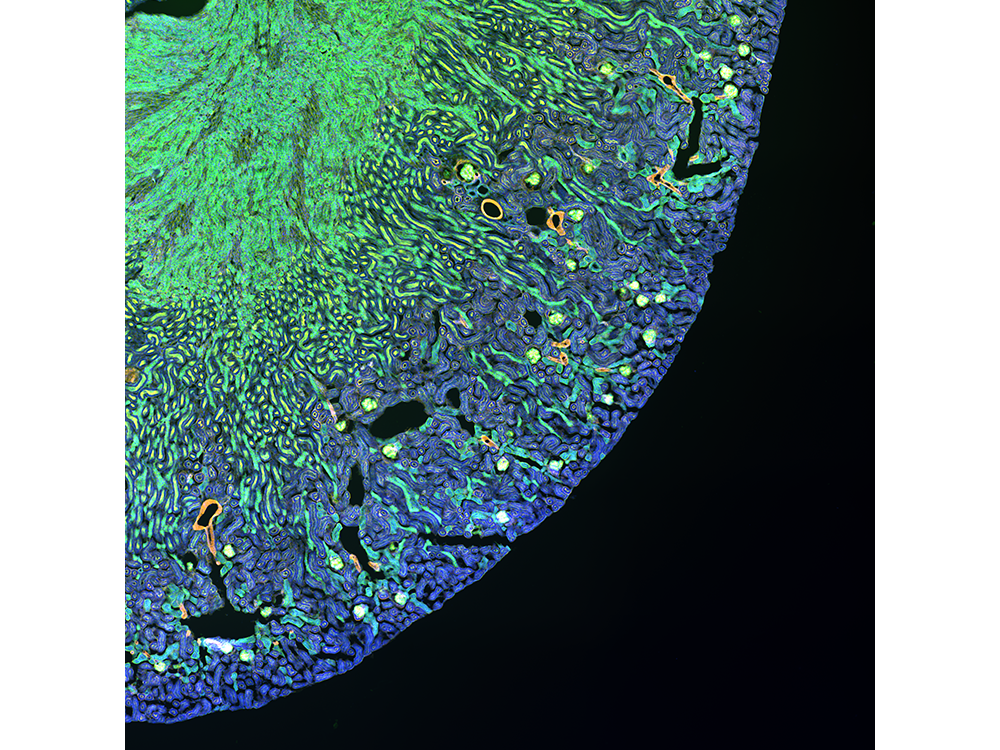
Ptk2 cellsStain: DAPI, Mitotracker Red, Acti-Stain 488. | Transverse rat brainStain: Hoechst, RPCA-NF-L-ct, and MCA-7D5. | Mouse kidneyAlexa Fluor 488 WGA, Alexa Fluor 568 Phalloidin, DAPI. |
Brightfield Imaging
|
|
|
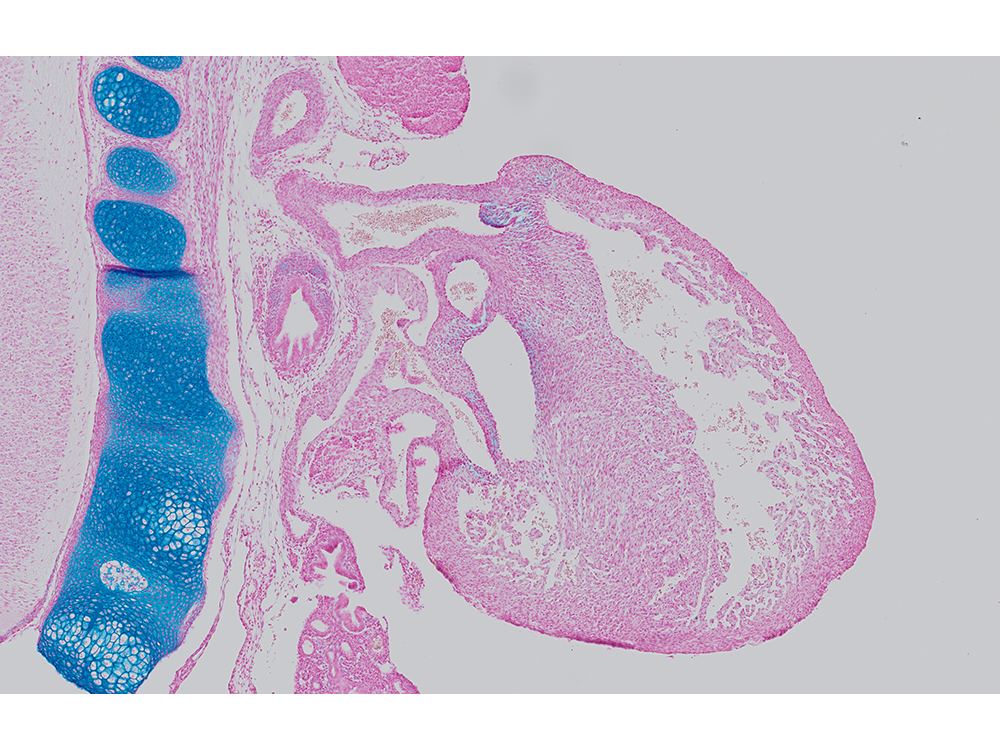
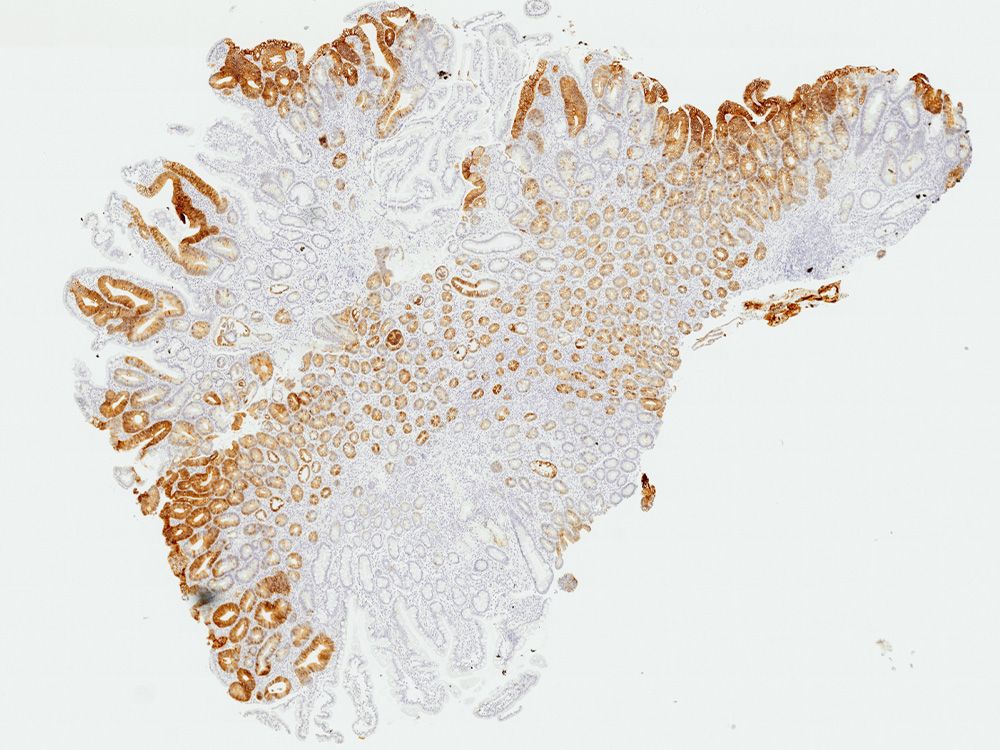
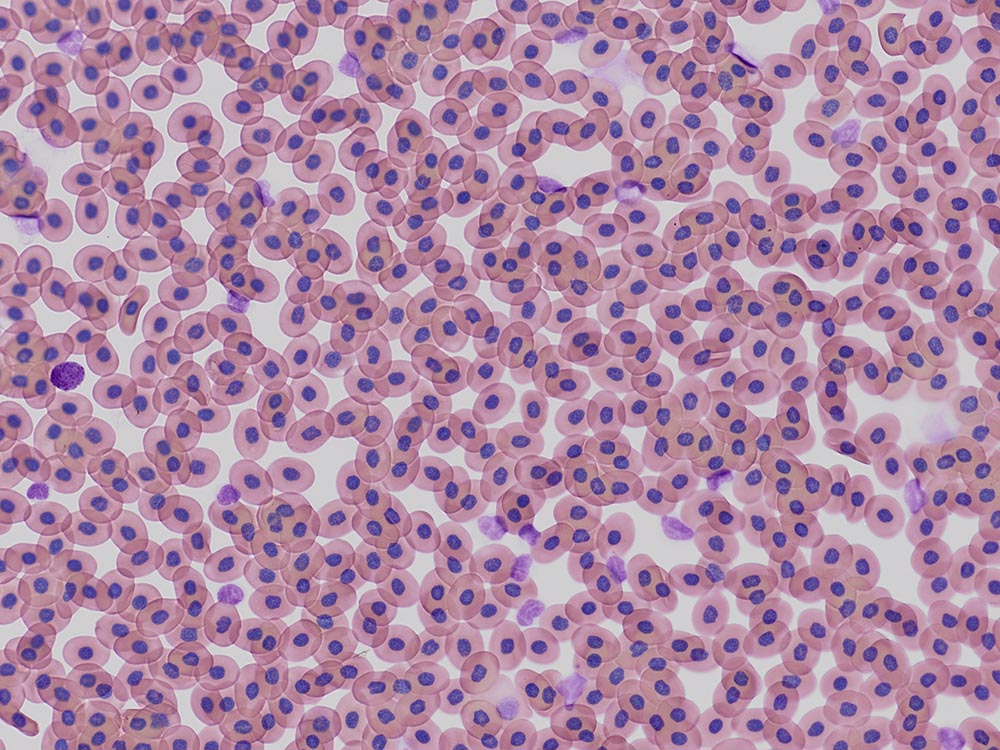
Alcian blue and nuclear fast red stained E15.5 mouse embryoImage data courtesy of 1.2.Naoki Takeshita, MD, 1.Kenta Yashiro Professer, MD, Ph.D., 1.Division of Developmental Biology and Anatomy, Department of Anatomy and 2.Department of Pediatrics, Graduate School of Medical Science, Kyoto Prefectural University of Medicine. | Adenoma tissue sampleStitched brightfield image captured with a LUCPLFLN40XPH objective. Image data courtesy of the German Cancer Research Center (Deutsches Krebsforschungszentrum, DKFZ). | Xenopus blood cellsStain: HE. |
|  |
|
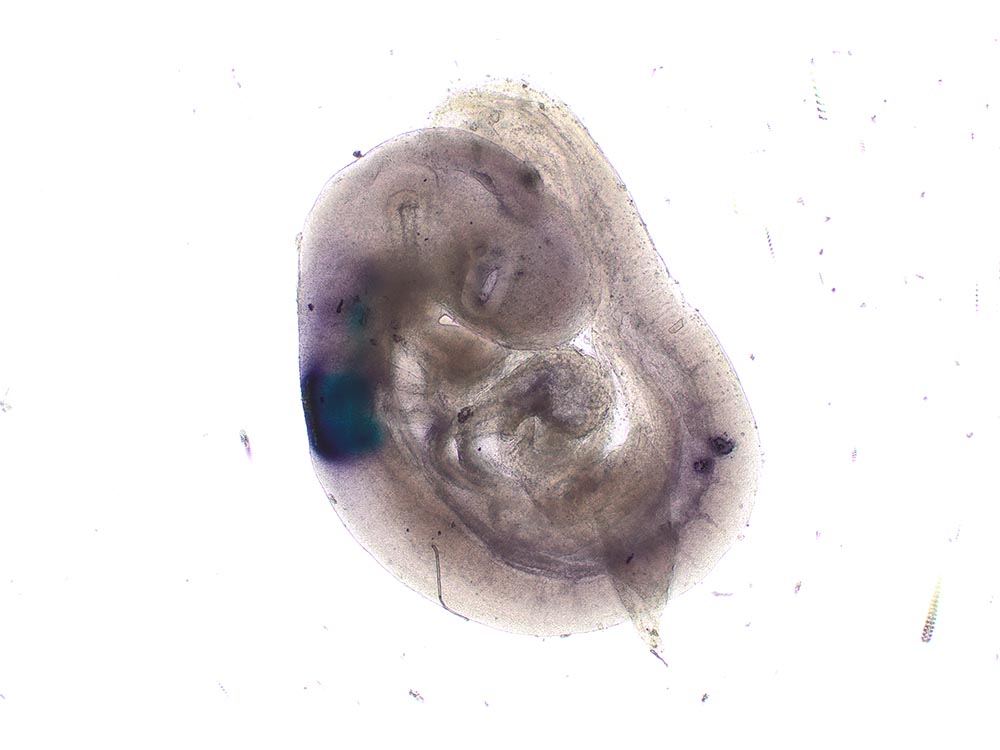
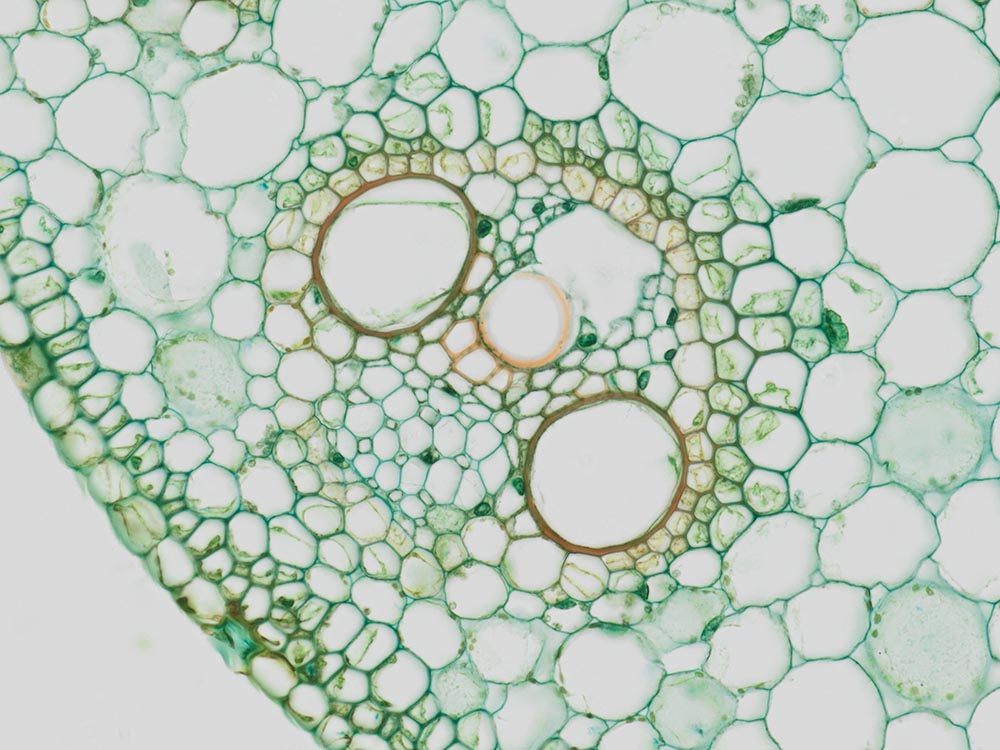
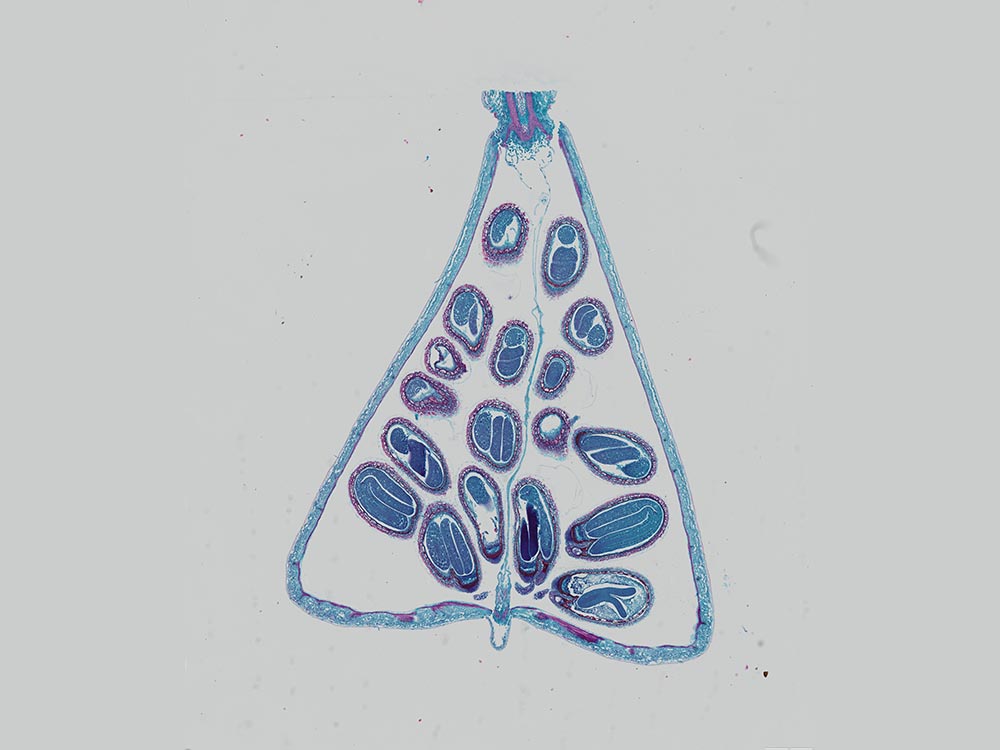
Corn stem cellStain: Safranin methyl blue. | Cyp26b1 expression pattern in E9.5 mouse embryo by whole mount in situ hybridizationImage data courtesy of 1.2.Naoki Takeshita, MD, 1.Kenta Yashiro Professer, MD, Ph.D., 1.Division of Developmental Biology and Anatomy, Department of Anatomy and 2.Department of Pediatrics, Graduate School of Medical Science, Kyoto Prefectural University of Medicine. | Shepherd's purse, mature embryo capsellaStain: Trichrome. |
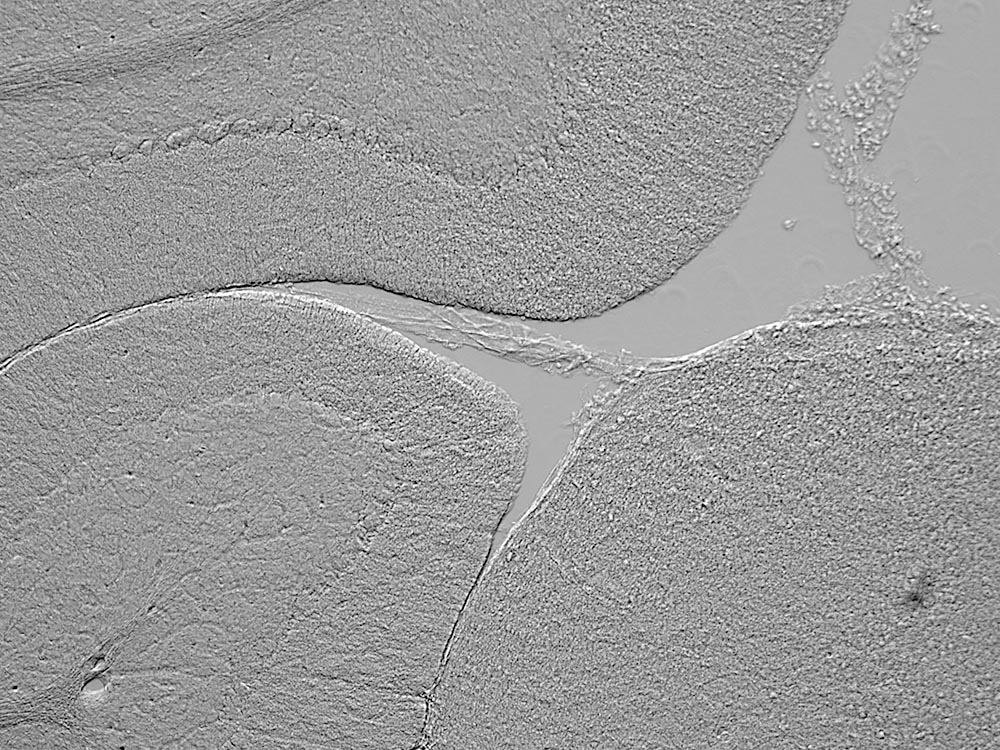
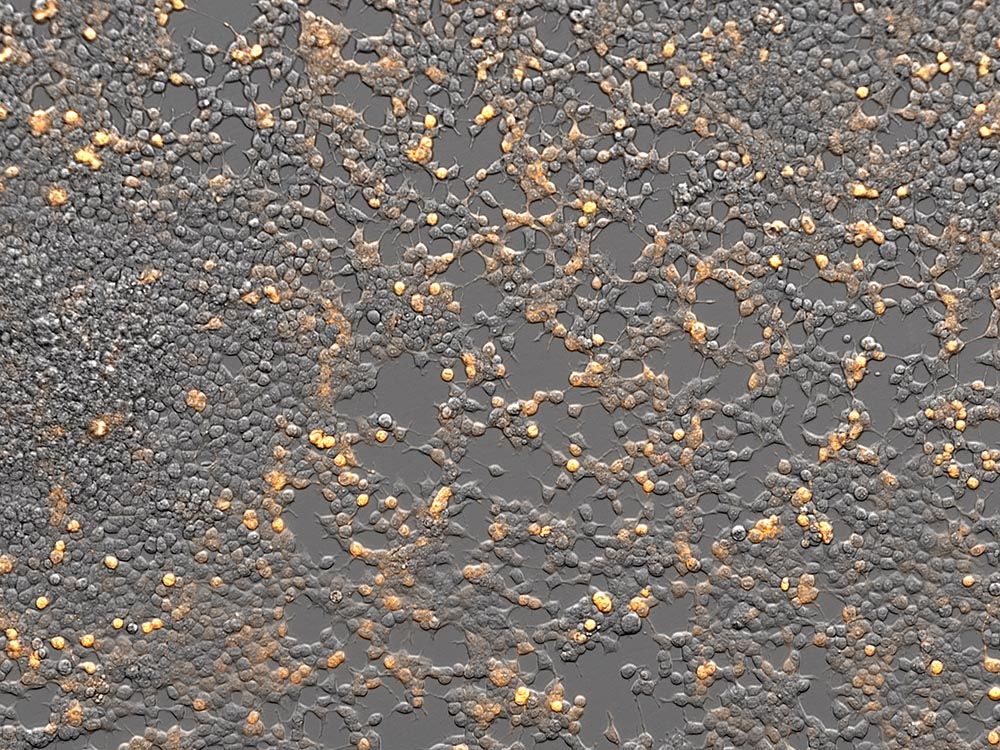 | Gradient Contrast: See Your Sample in a New Light
Expression of membrane -translocated mCherry in HEK293T cell. Image data courtesy of Rie Saba, Ph.D., Division of Developmental Biology and Anatomy, Department of Anatomy, Kyoto Prefectural University of Medicine. |
|---|
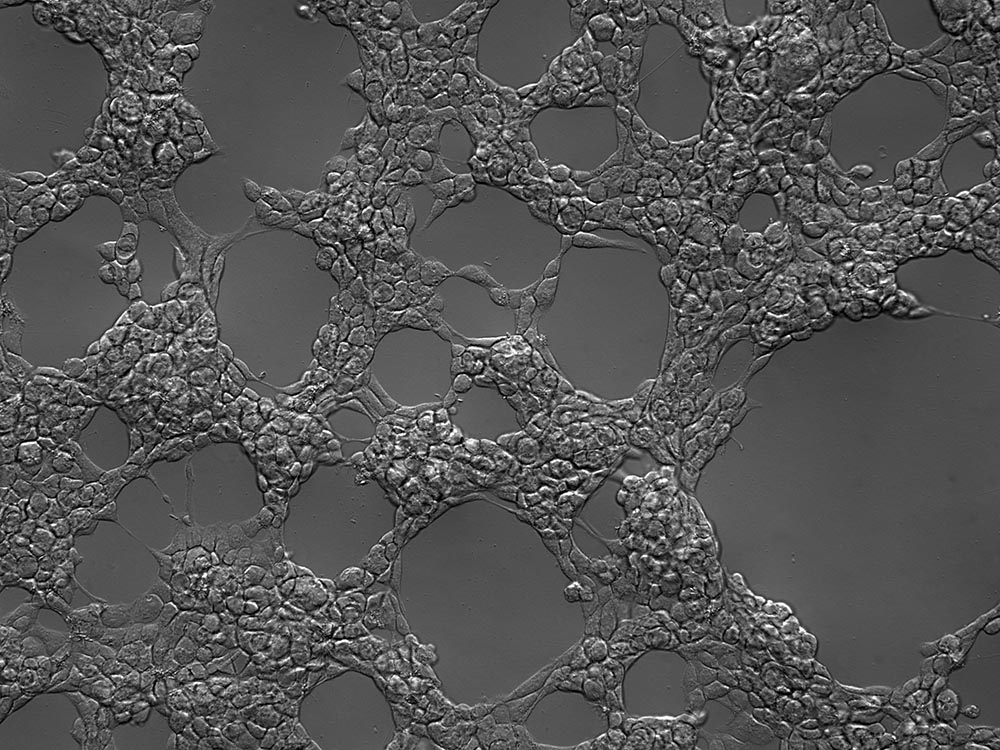
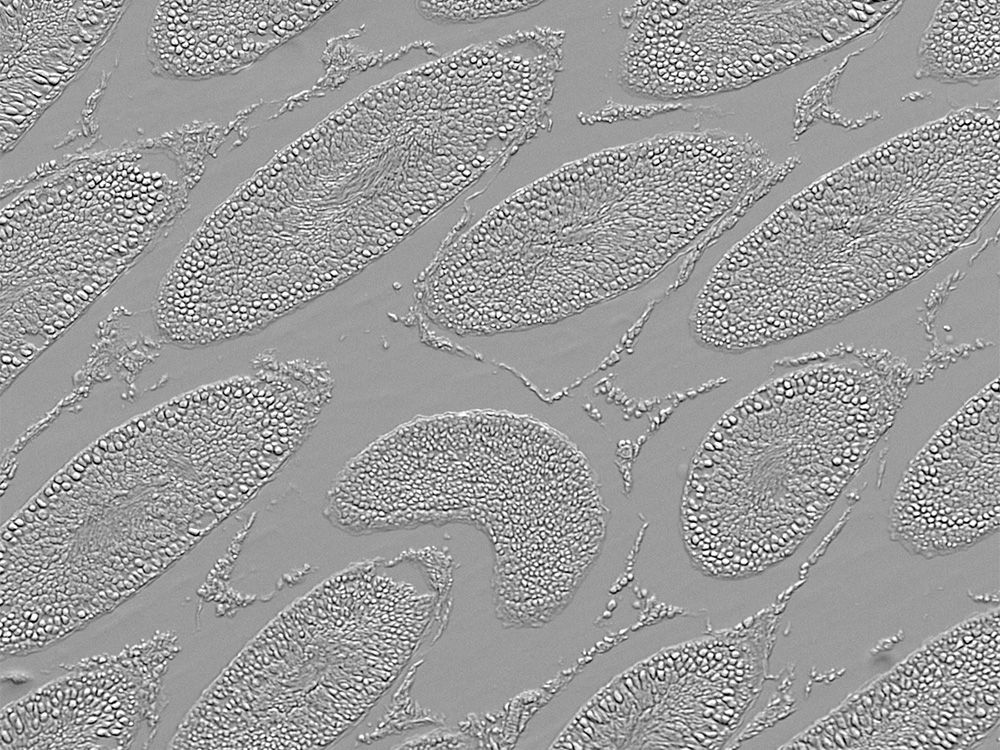
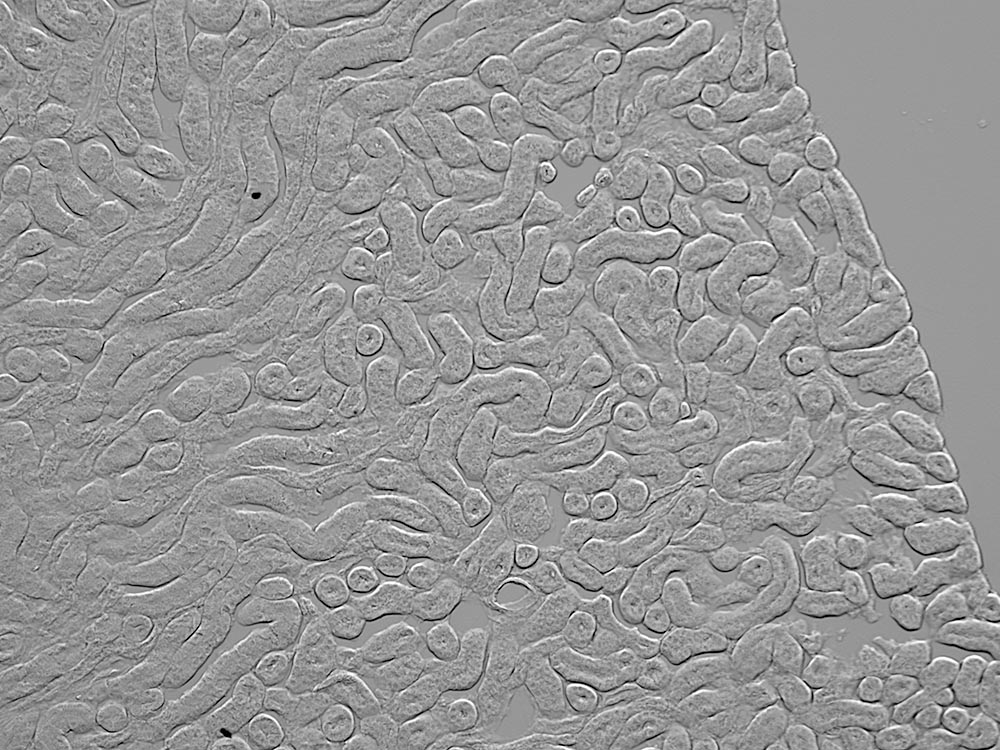
Images Captured with Gradient Contrast
Rat brain |
HEK-293 cells |
Rat testicles |
Mouse kidney |
Need more information?
Sorry, this page is not
available in your country.
Sorry, this page is not
available in your country.